Documentation/GVP:GVP85HSG/85/GIRGVPCT/MP3 16KBR
4.8 Testing the MP3 16 kbps Bit Rate
Support for MP3 16 kbps bit rate began with 8.5.1 iteration 3. To compare the performance with MP3 32 kbps bit rate, the testing was done on physical server and VM environments, using Windows 2008 R2 x64.
4.8.1 Physical Server on Single Hex Core
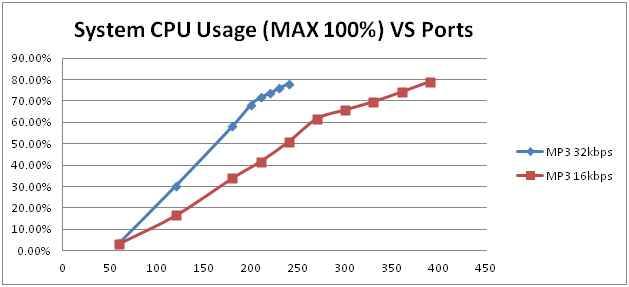
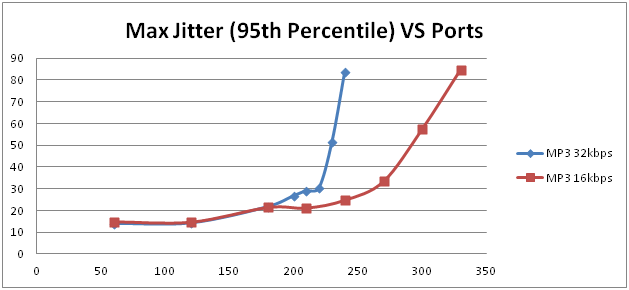
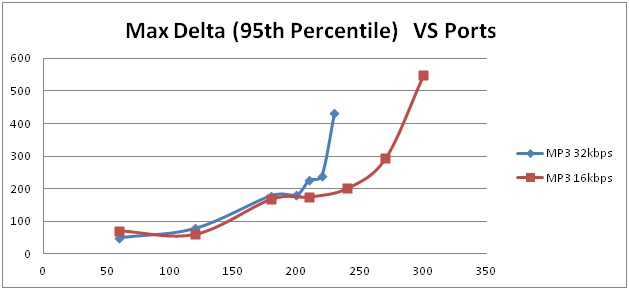
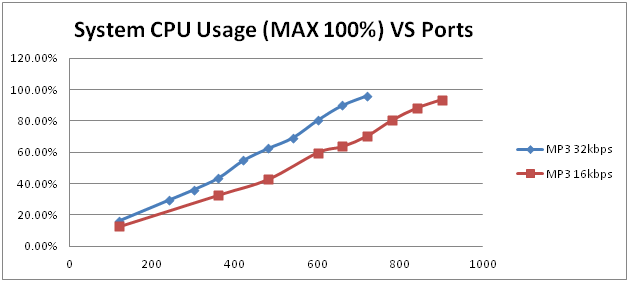
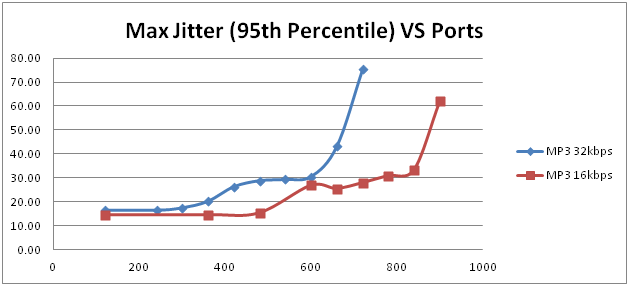
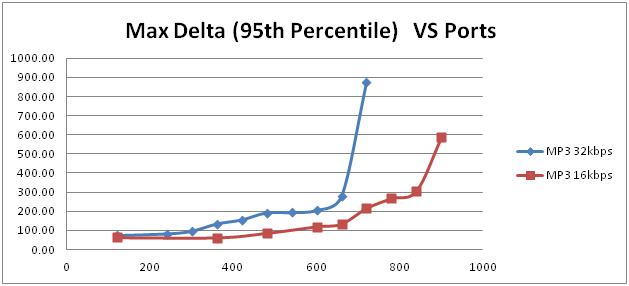
The testing was done on Hardware Profile 1: a physical server on a single hex core of Dell R410. The three graphs below compare system CPU usage and audio quality related metrics, max jitter and max delta.
MP3 16kbps consumes less CPU memory, which means higher port capacity. Figure 43 & 44 for Max Jitter and Max Delta also indicate higher port capacity of MP3 16kbps. 240 ports are the recommended port capacity for MP3 16 kbps which means 20% higher than recommended port capacity of MP3 32kbps (200 ports). Peak port capacity is 270 ports which is 22.7% higher than peak port capacity of MP3 32kbps (220 ports).
The table below lists the system disk IOPS:
| Ports | Physical Server Disk IOPS | ||
|---|---|---|---|
| Total | Read | Write | |
| 60 | 14.66 | 0.036 | 14.62 |
| 120 | 24.00 | 0.041 | 23.95 |
| 180 | 33.42 | 0.029 | 33.39 |
| 210 | 37.65 | 0.030 | 37.62 |
| 240 | 42.21 | 0.029 | 42.18 |
| 270 | 47.18 | 0.036 | 47.14 |
| 300 | 51.44 | 0.011 | 51.43 |
| 330 | 55.81 | 0.006 | 55.81 |
| 360 | 60.99 | 0.002 | 60.99 |
| 390 | 67.12 | 0.003 | 67.11 |
TableFigure 45: System Disk IOPS on Physical Server, MP3 only 16 Kbps
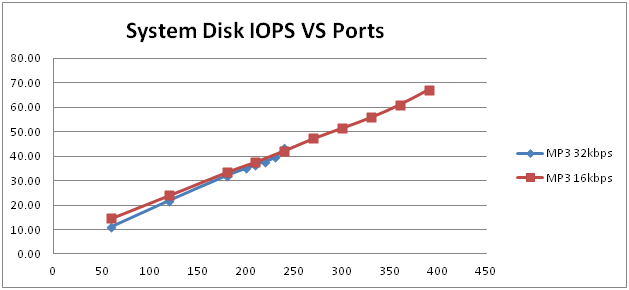
The graph below compares Figure 45 with Figure 5, both on a single hex core server:
The system disk IOPS for MP3 16kbps and 32kbps are nearly identical to each other; reasonable since the disk IO operations should be the same, and at the same port capacity, no matter which MP3 bit rate is chosen.
MCP IOPS is listed here:
| Ports | Physical Server MCP IOPS | ||
|---|---|---|---|
| Total | Read | Write | |
| 60 | 14.56 | 7.53 | 7.04 |
| 120 | 28.64 | 14.92 | 13.72 |
| 180 | 42.54 | 22.29 | 20.25 |
| 210 | 49.42 | 25.93 | 23.48 |
| 240 | 56.41 | 29.64 | 26.76 |
| 270 | 63.38 | 33.34 | 30.04 |
| 300 | 70.36 | 36.92 | 33.44 |
| 330 | 77.53 | 40.79 | 36.74 |
| 360 | 85.52 | 44.46 | 41.06 |
| 390 | 94.68 | 48.14 | 46.54 |
TableFigure 47: MCP IOPS on physical server of single hex core, MP3 only, 16 Kbps
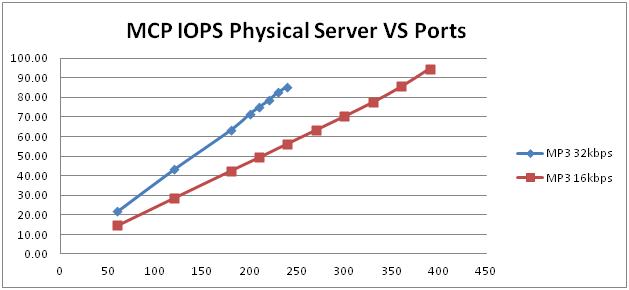
The graph below compares Figure 47 and Figure 37:
MP3 16kbps uses less IOPS at the process level, probably be due to fewer network operations for MP3 16kbps.
4.8.2 VMs on Dual Hex Cores Server
The testing for MP3 16kbps was conducted on VM Profile 4 (based on Hardware Profile 4, which is a dual hex cores server). 6 VMs were configured, while only one MCP was installed on each Windows VM. The three graphs below compare overall CPU usage, audio quality related max jitter and max delta for MP3 16kbps vs 32kbps:
MP3 16kbps consumes less CPU memory, which matches observation on the physical server in Figure 42. Both Max Jitter and Max Delta also show higher port capacity for MP3 16kbps, which also matches observation on physical server from Figure 43 & 44. 720 ports are recommended as preferred port capacity for MP3 16 kbps which is 20% higher than MP3 32kbps (600 ports). It’s the same increase as observed from physical server. Peak port capacity for MP3 16kpbs can be as high as 840 ports which is also 27.3% higher than MP3 32kbps peak port capacity (660 ports).
System disk IOPS is illustrated in below table:
| Ports | Overall 6 VMs Disk IOPS | ||
|---|---|---|---|
| Total | Read | Write | |
| 120 | 26.57 | 0.13 | 26.44 |
| 360 | 63.47 | 0.13 | 63.34 |
| 480 | 80.66 | 0.15 | 80.51 |
| 600 | 93.73 | 0.04 | 93.69 |
| 660 | 109.53 | 0.14 | 109.39 |
| 720 | 118.76 | 0.13 | 118.62 |
| 780 | 126.15 | 0.07 | 126.08 |
| 840 | 134.12 | 0.04 | 134.09 |
| 900 | 142.21 | 0.09 | 142.12 |
TableFigure 52: Overall Disk IOPS on all 6 VMs of dual hex cores, MP3 only, 16 Kbps
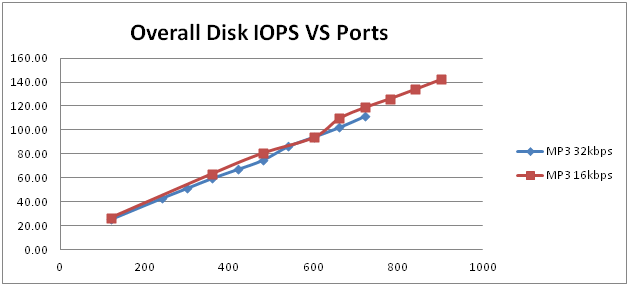
Below graph shows the comparison of overall disk IOPS of all 6 VMs for MP3 16kpbs vs 32kbps in Figure 17:
The IOPS from both MP3 16kbps and 32kbps are inline each other, as same as observed in physical server testing.
Data throughput for MP3 16kbps is listed in following table:
| Ports | Overall Disk KB/sec | SSD Drive Disk KB/sec | ||||
|---|---|---|---|---|---|---|
| Total KB/sec | Read KB/sec | Write KB/sec | Total KB/sec | Read KB/sec | Write KB/sec | |
| 120 | 318.17 | 0.68 |
317.49 |
296.313 | 0.001 | 296.312 |
| 360 | 892.94 | 0.52 | 892.42 | 856.077 | 0.001 | 856.076 |
| 480 | 1175.63 | 0.79 | 1174.84 | 1132.997 | 0.001 | 1132.996 |
| 600 | 1537.43 | 0.19 | 1537.23 | 1510.543 | 0.000 | 1510.543 |
| 660 | 1729.45 | 0.58 | 1728.87 | 1680.374 | 0.003 | 1680.371 |
| 720 | 1890.48 | 0.58 | 1889.90 | 1837.492 | 0.000 | 1837.492 |
| 780 | 2045.34 | 0.35 | 2045.00 | 1995.239 | 0.004 | 1995.235 |
| 840 | 2191.98 | 0.15 | 2191.83 | 2142.373 | 0.002 | 2142.371 |
| 900 | 2349.18 | 0.75 | 2348.44 | 2298.426 | 0.004 | 2298.422 |
TableFigure 54: Data Throughputs for MP3 only, 16 kbps
Use Formula 1 in Section 4.6:
MP3 bitrate * Ports / 8 = KB/sec
Or 16kbps * Ports / 8 =KB/sec if MP3 is 16kbps
Take two samples (120 & 720) from above table to apply formula 1 as below:
16 kpbs * 120 / 8 = 240 kb close to 296 in the table (in SSD)
16 kpbs * 720 / 8 = 14400 kb close to 1837 in the table (in SSD)
Similarly, the measurements from real testing for MP3 16kbps is slightly higher than calculation due to other files such as metadata and json files are save on the same cache folder. It approved the formula still stands.
MCP IOPS was also measured and listed in the following table:
| Ports | Overall 6 VMs MCP IOPS | ||
|---|---|---|---|
| Total | Reads | Writes | |
| 120 | 28.931 | 14.915 | 14.016 |
| 360 | 86.517 | 44.456 | 42.061 |
| 480 | 114.574 | 59.153 | 55.421 |
| 600 | 142.112 | 73.730 | 68.382 |
| 660 | 156.495 | 81.359 | 75.136 |
| 720 | 170.237 | 88.660 | 81.577 |
| 780 | 184.173 | 96.048 | 88.125 |
| 840 | 197.767 | 103.263 | 94.504 |
| 900 | 211.644 | 110.545 | 101.099 |
TableFigure 55: Overall MCP IOPS from 6 VMs of dual hex core, MP3 only, 16kbps
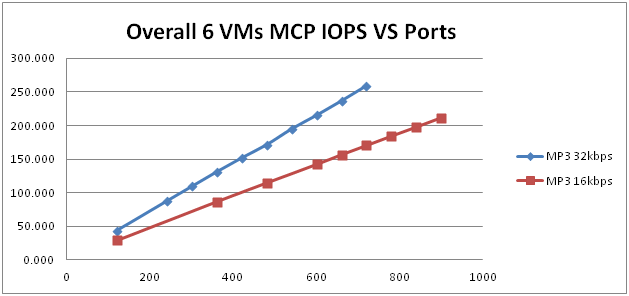
The graph below compares Overall MCP IOPS with MP3 32k MCP IOPS:
It shows same trend as observed in Figure 48 of physical server results.

