Documentation/GVP:GVP85HSG/85/GIRGVPCT/MP3 16KBR ENCR
Testing MP3 16 kbps Bit Rate with Encryption
Encryption was tested with MP3 16 kbps bit rate without dest2 physical server and VM env respectively, which compares with results of non encryption from Section 4.8. The OS remained Windows 2008 R2 x64.
Physical Server on Single Hex Core
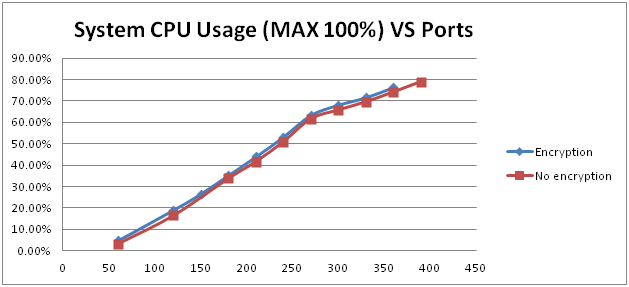
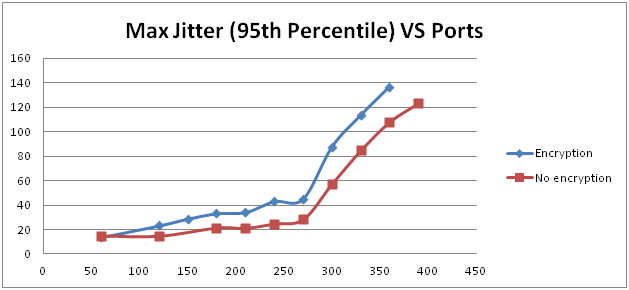
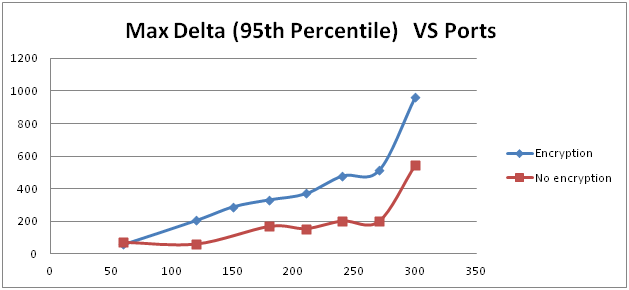
The testing was done on hardware profile 1, physical server on a single hex core of Dell R410. Below illustrates 3 graphs to compare system CPU usage and audio quality related metrics, max jitter and max delta.
It can be seen from above graphs that system CPU usage is quite close that encryption shows slightly higher CPU consumption, however, Max Jitter and Max Delta show much higher value for encryption. If slightly higher delay due to latency introduced by encryption is acceptable, the recommended and preferred port capacity could be 210 ports which is only 12.5% reduction of peak 240 ports from non encryption. If the audio quality strictly applies, the recommended ports can be as low as 120 ports. The peak port capacity can be considered as the same 270ports as non encryption if the some delay can be accepted.
The system disk IOPS is listed here:
| Ports | Physical Server Disk IOPS | ||
|---|---|---|---|
| Total | Reads | Writes | |
| 60 | 14.66 | 0.036 | 14.62 |
| 120 | 24.00 | 0.041 | 23.95 |
| 180 | 33.42 | 0.029 | 33.39 |
| 210 | 37.65 | 0.030 | 37.62 |
| 240 | 42.21 | 0.029 | 42.18 |
| 270 | 47.18 | 0.036 | 47.14 |
| 300 | 51.44 | 0.011 | 51.43 |
| 330 | 55.81 | 0.006 | 55.81 |
| 360 | 60.99 | 0.002 | 60.99 |
| 390 | 67.12 | 0.003 | 67.11 |
TableFigure 60: IOPS on physical server of single hex core, MP3 only, 16 Kbps, encryption
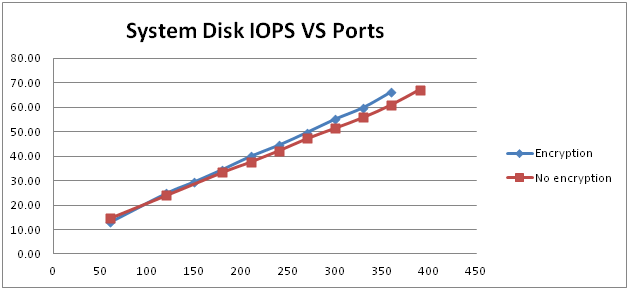
The graph below compares physical server IOPS with system disk IOPS of non encryption:
It shows the almost same system disk IOPS for both encryption and non encryption which also small increase can be observed at higher port capacity. It should be contributed by other disk IO operations such as encryption key files etc.
MCP IOPS is listed in the table below:
| Ports | Physical Server MCP IOPS | ||
|---|---|---|---|
| Total | Reads | Writes | |
| 60 | 16.53 | 8.88 | 7.65 |
| 120 | 32.59 | 17.69 | 14.91 |
| 150 | 40.40 | 21.96 | 18.44 |
| 180 | 48.46 | 26.46 | 22.01 |
| 210 | 56.35 | 30.83 | 25.52 |
| 240 | 64.32 | 35.24 | 29.08 |
| 270 | 72.28 | 39.64 | 32.64 |
| 300 | 80.06 | 43.95 | 36.11 |
| 330 | 88.61 | 48.53 | 40.07 |
| 360 | 100.48 | 52.91 | 47.57 |
TableFigure 62: MCP IOPS on physical server of single hex core, MP3 only, 16 Kbps, encryption
The graph below compares total MCP IOPS between encryption and non encryption:
[[File: GIR_phys_mcp_IOPS_vs_ports_1.png |frame|none|500px|Figure 63: MCP IOPS on Single Hex Core Physical Server, MP3 16Kbps encryption vs non encryption]
It shows slightly higher and higher MCP IOPS for encryption when port capacity increases. As seen in Figure 61, increase for disk IOPS is much smaller for encryption, so here the increase should be contributed by network IOs.
VMs on Dual Hex Cores Server
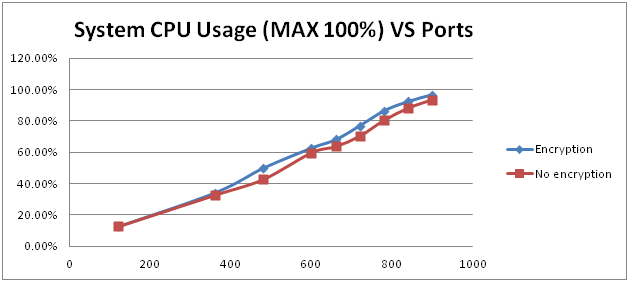
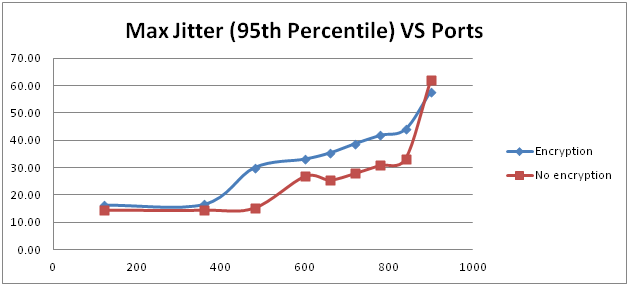
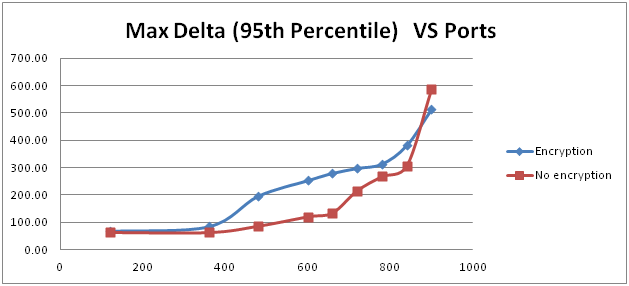
The testing for MP3 16kbps with encryption was conducted on the VM Profile 4 based on Hardware Profile 4 of dual hex cores server, same as non encryption in Section 4.8.2. Six VMs were configured while only one MCP was installed on each Windows VM. Below are three graphs illustrating comparison of overall CPU usage, audio quality related max jitter and max delta for MP3 16kbps encryption vs non encryption:
Similar trend can be observed on VM env that slightly overall CPU usage while much higher max jitter and max delta can be seen for encryption profile. Apply same criteria from physical server result that if slightly higher delay due to latency introduced by encryption is acceptable, the recommended and preferred port capacity could be 600 ports which is only 16.7% reduction of peak 720 ports from non encryption. If the audio quality strictly applies, the recommended ports can be as low as 480 ports. The peak port capacity can be considered as the same 840ports as non encryption if the some delay can be accepted.
The overall system disk IOPS for all 6 VMs is listed here:
| Ports | Overall 6 VMs Disk IOPS | SSD Drive Disk IOPS | ||||
|---|---|---|---|---|---|---|
| Total | Reads | Writes | Total | Reads | Writes | |
| 120 | 28.70 | 0.004 | 28.69 | 21.881 | 0.000 | 21.881 |
| 360 | 67.46 | 0.004 | 67.46 | 56.238 | 0.000 | 56.238 |
| 480 |
87.56 |
0.026 | 87.54 | 74.903 | 0.000 | 74.903 |
| 600 | 108.01 | 0.015 | 107.99 | 93.647 | 0.000 | 93.647 |
| 660 | 119.49 | 0.005 | 119.48 | 104.304 | 0.000 | 104.304 |
| 720 |
128.76 |
0.020 | 128.74 | 114.441 | 0.000 | 114.441 |
| 780 | 137.68 | 0.015 | 137.66 | 123.210 | 0.002 | 123.209 |
| 840 | 146.99 | 0.009 | 146.98 | 132.646 | 0.002 | 132.644 |
| 900 | 154.68 | 0.025 | 154.66 | 140.145 | 0.002 | 140.143 |
TableFigure 67: Overall Disk IOPS on all 6 VMs of dual hex cores, MP3 only, 16 Kbps, encryption
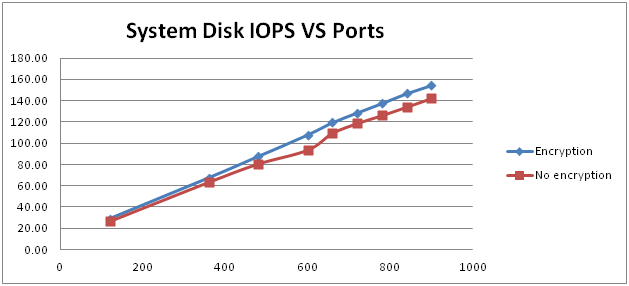
Below is the graph to compare system disk IOPS between encryption and non encryption on same VM env.
It shows the similar trend as observed in physical server that small increase happens for encryption when port capacity increases. It should be same reason that extra disk IO operations is used such as encryption key files etc.
Data throughputs for encryption is listed here:
| Ports | Overall Disk KB/sec | SSD Drive Disk KB/sec | ||||
|---|---|---|---|---|---|---|
| Total KB/sec | Read KB/sec | Write KB/sec | Total KB/sec | Read KB/sec | Write KB/sec | |
| 120 | 387.99 | 0.02 | 387.97 | 304.229 | 0.000 | 304.229 |
| 360 | 1096.82 | 22.54 | 1074.28 | 876.599 | 0.000 | 876.599 |
| 480 | 1344.60 | 107.95 | 1236.65 | 1191.403 | 0.006 | 1191.397 |
| 600 | 2187.50 | 348.40 | 1839.09 | 1532.171 | 0.000 | 1532.171 |
| 660 | 2024.16 | 35.09 | 1989.07 | 1652.232 | 0.000 | 1652.232 |
| 720 | 1955.33 | 99.81 | 1855.51 | 1803.207 | 0.006 | 1803.201 |
| 780 | 2572.79 | 205.15 | 2367.64 | 1982.733 | 0.024 | 1982.709 |
| 840 | 2534.97 | 28.65 | 2506.32 | 2097.871 | 0.043 | 2097.829 |
| 900 | 2851.85 | 119.47 | 2732.38 | 2297.264 | 0.007 | 2297.257 |
TableFigure 69: Data Throughputs for MP3 only, 16 kbps, encryption
Use Formula 1 in Section 4.6:
MP3 bitrate * Ports / 8 = KB/sec
Or 16kbps * Ports / 8 =KB/sec if MP3 is 16kbps
Take two samples (120 & 720) from above table to apply formula 1 as below:
16 kpbs * 120 / 8 = 240 kb close to 304 in the table (in SSD)
16 kpbs * 720 / 8 = 14400 kb close to 1803 in the table (in SSD)
Similarly, the measurements from real testing for MP3 16kbps encryption is slightly higher than calculation due to other files such as metadata and JSON files are save on the same cache folder. It approved the formula still stands.
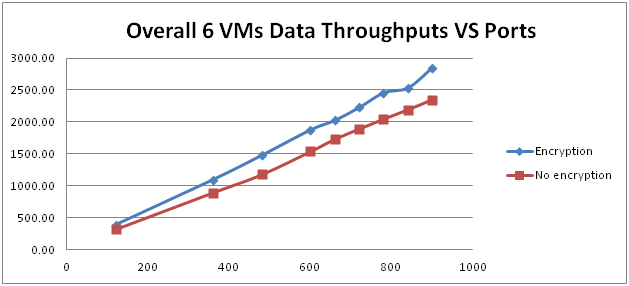
To compare overall data throughputs with non encryption, we have graph below:
The data throughputs for encryption increase slightly when port capacity increases, matching a similar trend with system disk IOPS.
The table below lists overall MCP IOPS from all 6 VMs:
| Ports | Overall 6 VMs MCP IOPS | ||
|---|---|---|---|
| Total | Reads | Writes | |
| 120 | 34.874 | 17.638 | 17.236 |
| 360 | 102.624 | 52.900 | 49.724 |
| 480 | 130.285 | 70.377 | 59.909 |
| 600 | 168.849 | 87.766 | 81.083 |
| 660 | 186.175 | 96.882 | 89.293 |
| 720 | 193.248 | 105.171 | 88.077 |
| 780 | 219.395 | 114.398 | 104.997 |
| 840 | 235.730 | 123.009 | 112.720 |
| 900 | 252.198 | 131.682 | 120.516 |
TableFigure 71: Overall MCP IOPS from 6 VMs of dual hex core, MP3 only, 16kbps, encryption
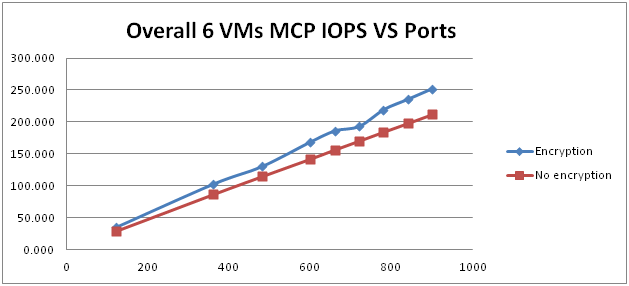
The graph below compares performance of the same configuration, except with non-encryption:
Performance is slightly higher <???> with MCP IOPS from encryption, similar to the trend expressed in physical server results.

