(Created target blank page For Version: PSAAS:Public) |
(Modified comment string {{Template:PEC_Migrated}} with __NOINDEX__ {{Template:PEC_Migrated}}) |
||
| (4 intermediate revisions by 3 users not shown) | |||
| Line 1: | Line 1: | ||
| − | < | + | =Real-time Reporting with Genesys Pulse 8.5= |
| + | |||
| + | __NOINDEX__ | ||
| + | {{Template:PEC_Migrated}} | ||
| + | |||
| + | |||
| + | <onlyinclude> | ||
| + | {{BEC_Head | ||
| + | |dimension=RealTime | ||
| + | |context=Genesys Pulse provides at-a-glance views of real-time contact center statistics on dashboards within the user interface. | ||
| + | |role=Supervisor | ||
| + | }} | ||
| + | {{NoteFormat|You require the appropriate user privileges to perform actions.}} | ||
| + | |||
| + | __NOTOC__ | ||
| + | |||
| + | {{CloudStep_Stack | ||
| + | |title= | ||
| + | |text=You can | ||
| + | * view reports in widgets on either your Genesys Pulse [[RTRUserAccess|dashboard or wallboard]]. | ||
| + | * customize [[RTRWidgets|widgets]] to display user-defined Donut, Grid, Key Performance Indicator (KPI), or List charts. | ||
| + | * use custom [[RTRTemplates|templates]] to quickly create report widgets for your dashboard. | ||
| + | |||
| + | Ready? [[RTRQuickStart|Get started]]. | ||
| + | |||
| + | Looking for answers to specific questions? Try these topics: | ||
| + | *[[RTRReports|Popular real-time reports]] | ||
| + | * [[RTRUserAccess|Manage dashboards and wallboards]] | ||
| + | * [[RTRDashboardExample|Dashboard and wallboard examples]] | ||
| + | *[[RTRWidgets|Add reports to your dashboard or wallboard]] | ||
| + | *[[RTRWidgetExternal|Display external content]] | ||
| + | *[[RTRStatProperties|Statistic properties]] | ||
| + | |media1=Pulse85105IntroDashboard.png | ||
| + | }} | ||
| + | |||
| + | ==New to Pulse== | ||
| + | Your version of Pulse might not include all the new functionality covered in this guide: | ||
| + | * Wallboards are now available. | ||
| + | |||
| + | [[Category:V:PSAAS:Public]] | ||
Latest revision as of 12:32, October 2, 2020
Real-time Reporting with Genesys Pulse 8.5
Important
This content may not be the latest Genesys Engage cloud content. To find the latest content, go to Reporting in Genesys Engage cloud.
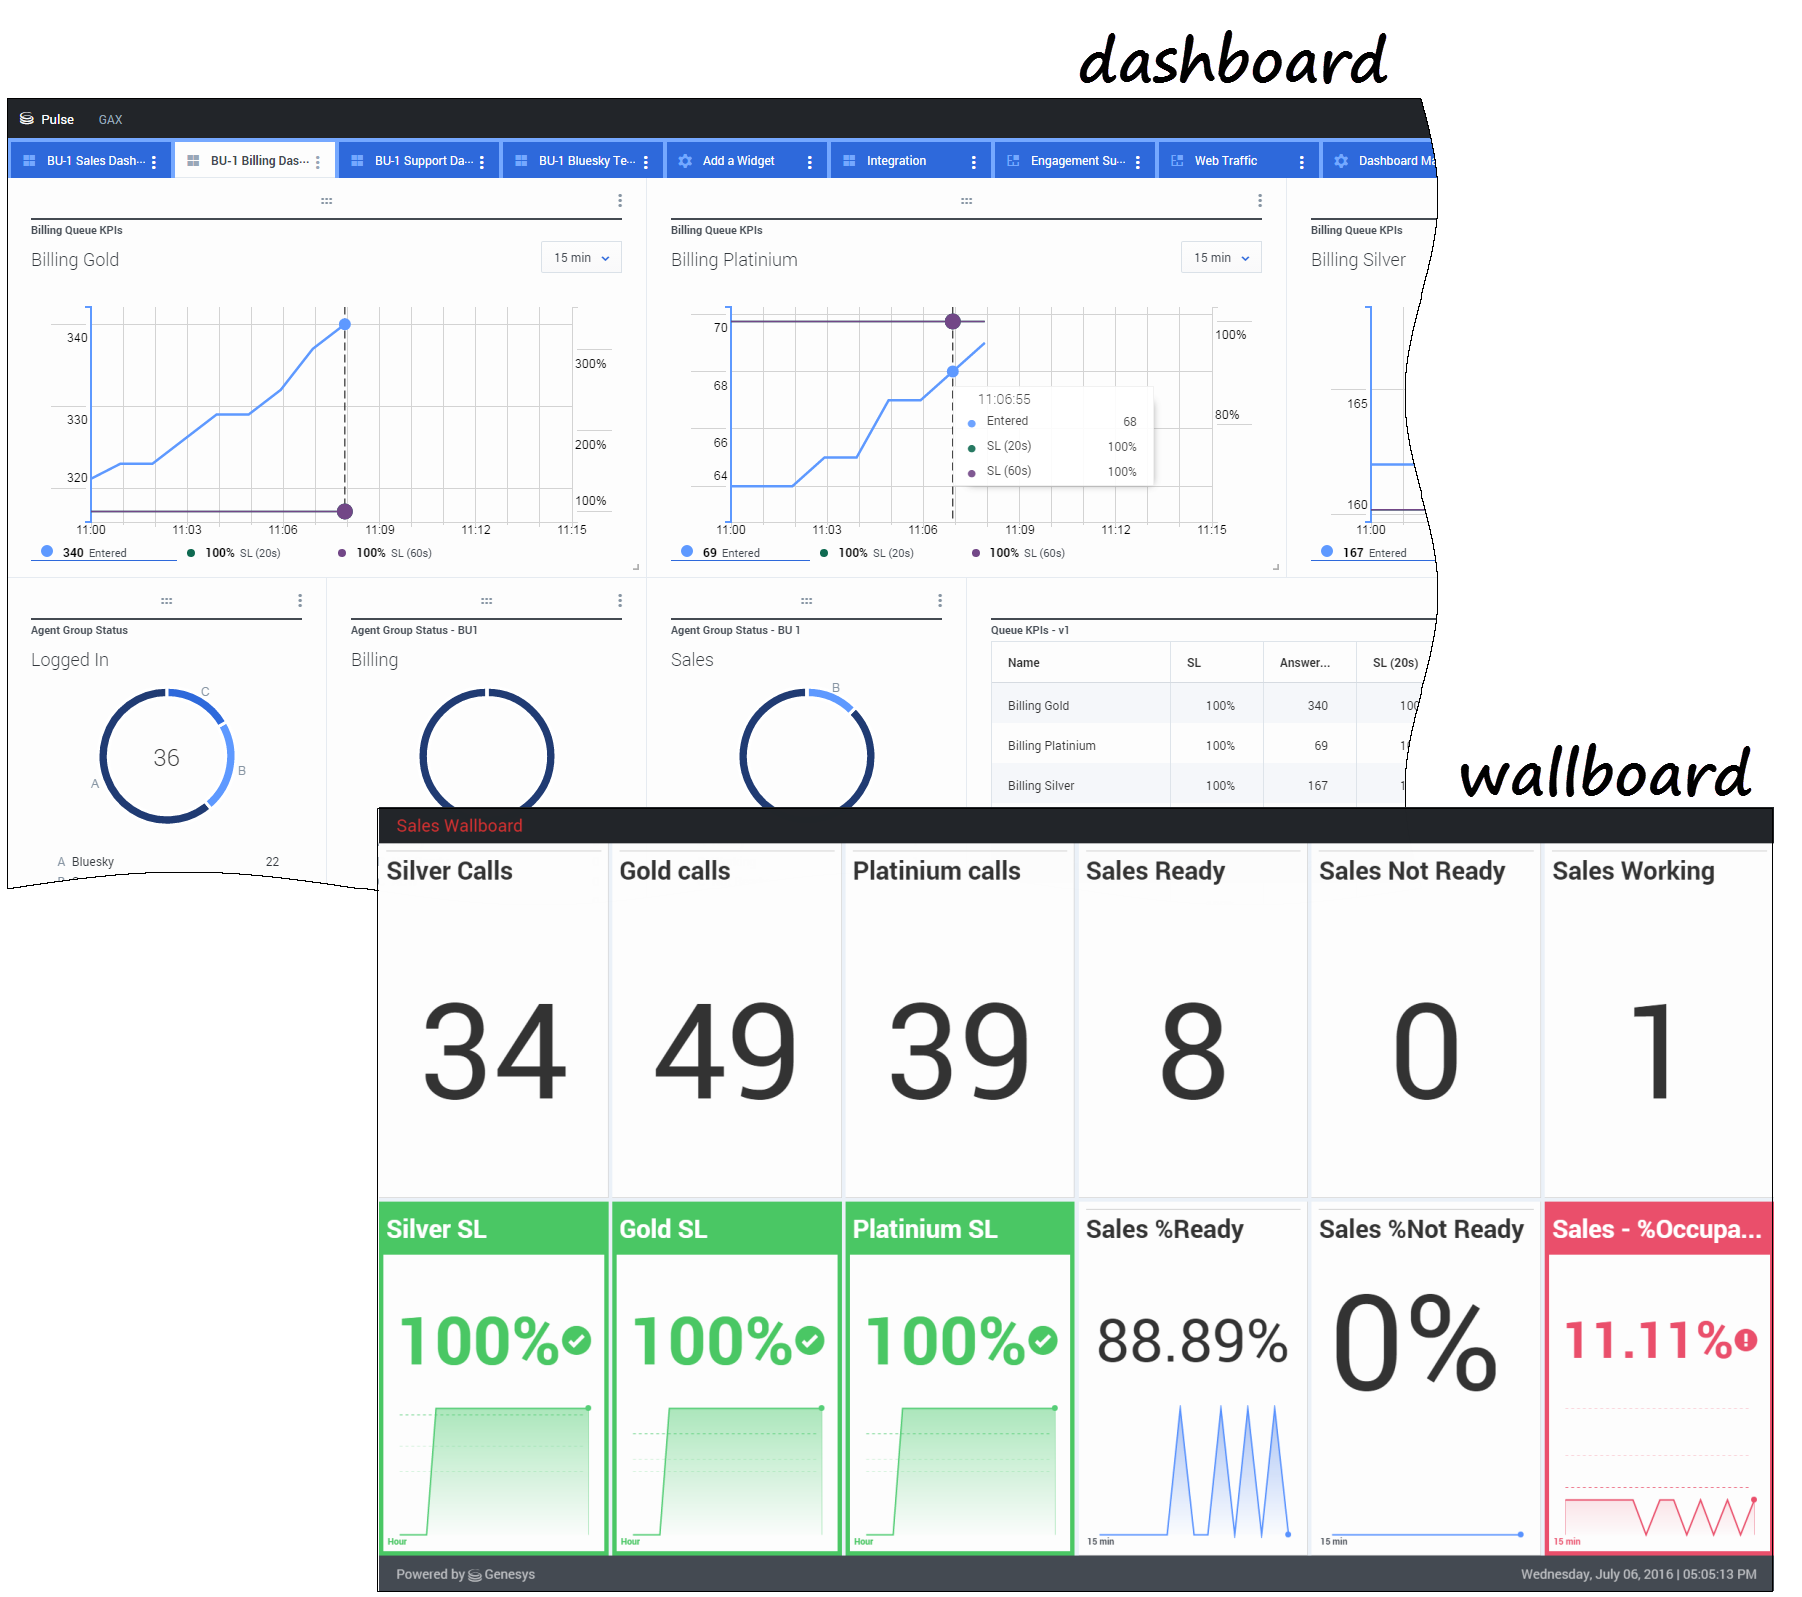
Genesys Pulse provides at-a-glance views of real-time contact center statistics on dashboards within the user interface.
Important
You require the appropriate user privileges to perform actions.
You can
- view reports in widgets on either your Genesys Pulse dashboard or wallboard.
- customize widgets to display user-defined Donut, Grid, Key Performance Indicator (KPI), or List charts.
- use custom templates to quickly create report widgets for your dashboard.
Ready? Get started.
Looking for answers to specific questions? Try these topics:
New to Pulse
Your version of Pulse might not include all the new functionality covered in this guide:
- Wallboards are now available.
This page was last edited on October 2, 2020, at 12:32.
Comments or questions about this documentation? Contact us for support!

