
reporting.case.report-case-in-focus-duration
Section: interaction-workspace
Default Value: false
Valid Values: true, false
Changes Take Effect: After the next platform configuration refresh interval.
Introduced: 9.0.000.31
Specifies whether the time that an interaction has been in the focus of the agent during its handling is reported to T-Server or Interaction Server at the end of its processing by the agent. When it is enabled, this notification allows Genesys Interaction Concentrator and Genesys Info Mart to calculate some focus time metrics.
permissions.agent-group.restrict
Section: interaction-workspace
Default Value: No default value
Valid Values: Comma-separated list of Agent Groups; empty means no filtering.
Changes Take Effect: Immediately
Introduced: 9.0.000.31
Modified: 9.0.000.74
Related Options: permissions.agent-group.exclude
Specifies the list of agent groups that are returned for searches and statistics. Overrides the permissions.agent-group.exclude option. Virtual agent groups are not supported.
permissions.agent-group.exclude
Section: interaction-workspace
Default Value: No default value
Valid Values: Comma-separated list of Agent Groups; empty means no exclusion.
Changes Take Effect: Immediately
Introduced: 9.0.000.31
Modified: 9.0.000.74
Related Options: permissions.agent-group.restrict
Specifies the list of agent groups to be excluded from searches and statistics. Virtual agent groups are not supported. This option is overridden by the permissions.agent-group.restrict option.
statistics.gadget-statistics
Section: interaction-workspace
Default Value: No default value
Valid Values: A comma-separated list of Statistic names.
Changes Take Effect: After the next platform configuration refresh interval.
Introduced: 9.0.000.31
Specifies the statistics, up to 10, that are displayed in the Statistics Gadget. Each statistics specified in this option is the name of a section containing the statistic definition or the statistic object.
statistics.gadget-statistics.max-size
Section: interaction-workspace
Default Value: 10
Valid Values: An integer value from 1 through 50.
Changes Take Effect: After the next platform configuration refresh interval.
Introduced: 9.0.000.31
Modified: 9.0.000.61
Related Options: statistics.gadget-statistics
Specifies the maximum number of statistics that are displayed in the Statistics Gadget. If more statistics are specified by the statistics.gadget-statistics option, only the first 'n' statistics are displayed.
statistics.gadget-statistics
Section: interaction-workspace
Default Value: No default value
Valid Values: A comma-separated list of Statistic names.
Changes Take Effect: After the next platform configuration refresh interval.
Introduced: 9.0.000.31
Specifies the statistics, up to 10, that are displayed in the Statistics Gadget. Each statistics specified in this option is the name of a section containing the statistic definition or the statistic object.
statistics.refresh-time
Section: interaction-workspace
Default Value: 20
Valid Values: An integer value greater than 0.
Changes Take Effect: After the next platform configuration refresh interval.
Introduced: 9.0.000.31
Specifies, in seconds, how often statistics are refreshed in the Contact Center Statistics tab. When set to 0, no automatic refresh occurs (the agent must manually refresh statistics).
permissions.agent-group.restrict
Section: interaction-workspace
Default Value: No default value
Valid Values: Comma-separated list of Agent Groups; empty means no filtering.
Changes Take Effect: Immediately
Introduced: 9.0.000.31
Modified: 9.0.000.74
Related Options: permissions.agent-group.exclude
Specifies the list of agent groups that are returned for searches and statistics. Overrides the permissions.agent-group.exclude option. Virtual agent groups are not supported.
permissions.agent-group.exclude
Section: interaction-workspace
Default Value: No default value
Valid Values: Comma-separated list of Agent Groups; empty means no exclusion.
Changes Take Effect: Immediately
Introduced: 9.0.000.31
Modified: 9.0.000.74
Related Options: permissions.agent-group.restrict
Specifies the list of agent groups to be excluded from searches and statistics. Virtual agent groups are not supported. This option is overridden by the permissions.agent-group.restrict option.
statistics.virtual-queues
Section: interaction-workspace
Default Value: No default value
Valid Values:
Changes Take Effect: After the next platform configuration refresh interval.
Introduced: 9.0.000.31
Specifies the list of virtual queues that are displayed in the Contact Center Statistics tab. If empty, no virtual queues are displayed. If set to a list and none of the virtual queues in the list match an existing virtual queue, no virtual queues are displayed.
statistics.routing-points
Section: interaction-workspace
Default Value: No default value
Valid Values:
Changes Take Effect: After the next platform configuration refresh interval.
Introduced: 9.0.000.31
Specifies the list of routing points that are displayed in the Contact Center Statistics tab. If empty, no routing points are displayed. If set to a list and none of the routing points match an existing routing point, no routing points are displayed.
statistics.agent-groups
Section: interaction-workspace
Default Value: No default value
Valid Values:
Changes Take Effect: After the next platform configuration refresh interval.
Introduced: 9.0.000.31
Specifies the list of agent groups and virtual agent groups that are displayed in the Contact Center Statistics tab. If empty, no agent groups or virtual agent groups are displayed. If set to a list and none of the groups in the list match an existing group, no agent groups or virtual agent groups are displayed.
statistics.queue-groups
Section: interaction-workspace
Default Value: No default value
Valid Values:
Changes Take Effect: After the next platform configuration refresh interval.
Introduced: 9.0.000.31
Specifies the list of queue groups that are displayed in the Contact Center Statistics tab. If empty, no queue groups are displayed. If set to a list and none of the queue groups in the list match an existing queue group, no queue groups are displayed.
statistics.displayed-statistics
Section: interaction-workspace
Default Value: No default value
Valid Values: A comma-separated list of Statistic names.
Changes Take Effect: After the next platform configuration refresh interval.
Introduced: 9.0.000.31
Specifies the statistics that are displayed in the Contact Center Statistics tab. The statistics specified by this option match the names of the statistics defined in the options of the Application sections.
privilege.monitor-dashboard.can-use
Section: interaction-workspace
Default Value: true
Valid Values: true, false.
Changes Take Effect: After the next platform configuration refresh interval.
Introduced: 9.0.000.31
Modified: 9.0.000.68
Enables the Contact Center Statistics dashboard tab.
statistics.displayed-statistics
Section: interaction-workspace
Default Value: No default value
Valid Values: A comma-separated list of Statistic names.
Changes Take Effect: After the next platform configuration refresh interval.
Introduced: 9.0.000.31
Specifies the statistics that are displayed in the Contact Center Statistics tab. The statistics specified by this option match the names of the statistics defined in the options of the Application sections.
kpi.displayed-kpis
Section: interaction-workspace
Default Value: No default value
Valid Values: A comma-separated list of KPI names.
Changes Take Effect: After the next platform configuration refresh interval.
Introduced: 9.0.000.31
Specifies the KPIs that are displayed to the agent. The KPI names refer to the names of the Application Option sections that are defining the KPIs.
privilege.performance-tracker.can-use
Section: interaction-workspace
Default Value: false
Valid Values: true, false.
Changes Take Effect: After the next platform configuration refresh interval.
Introduced: 9.0.000.31
Enables access to the Performance Tracker.
kpi.displayed-kpis
Section: interaction-workspace
Default Value: No default value
Valid Values: A comma-separated list of KPI names.
Changes Take Effect: After the next platform configuration refresh interval.
Introduced: 9.0.000.31
Specifies the KPIs that are displayed to the agent. The KPI names refer to the names of the Application Option sections that are defining the KPIs.
(→Contact Center Statistics) |
|||
| (26 intermediate revisions by 3 users not shown) | |||
| Line 1: | Line 1: | ||
=Enabling agents to view KPIs and Contact Center Statistics= | =Enabling agents to view KPIs and Contact Center Statistics= | ||
| − | + | Agent Workspace includes two optional views and the [[EnablingAgentstoViewKPIs#StatisticsGadget|Statistics Gadget]] that you can configure to display real-time agent [[EnablingAgentstoViewKPIs#KPIs|Key Performance Indicators (KPIs)]] ('''Performance Tracker''') and [[EnablingAgentstoViewKPIs#ContactCenterStatistics|contact center statistics]] ('''Dashboard'''). KPIs enable agents to focus on their efficiency against the expectations of the contact center. Contact center statistics enable agents to see the overall performance of their contact center in a dashboard. | |
| − | |||
| − | |||
| − | |||
Workspace does not come with default KPIs and Statistics set up for you to display to your agents. However, a wide range of statistic definitions are supported that you can call on through configuration to display in the '''Performance Tracker''' and the '''Dashboard'''. | Workspace does not come with default KPIs and Statistics set up for you to display to your agents. However, a wide range of statistic definitions are supported that you can call on through configuration to display in the '''Performance Tracker''' and the '''Dashboard'''. | ||
| Line 14: | Line 11: | ||
name=CurrentReadyAgents_EXT | name=CurrentReadyAgents_EXT | ||
location=/ | location=/ | ||
| − | notificationFrequency= | + | notificationFrequency=60 |
insensitivity=1 | insensitivity=1 | ||
category=CurrentNumber | category=CurrentNumber | ||
| Line 25: | Line 22: | ||
The name in square brackets is the definition name. The name following "name=" is the statistic name. The type following "objectTypes=" informs you of the scope of the statistics, such as '''Agent''', '''GroupAgents''', '''RoutingPoint''', and so on. | The name in square brackets is the definition name. The name following "name=" is the statistic name. The type following "objectTypes=" informs you of the scope of the statistics, such as '''Agent''', '''GroupAgents''', '''RoutingPoint''', and so on. | ||
| − | + | {{AnchorDiv|Statistics_Definitions.cfg}} | |
The following definitions are supported: | The following definitions are supported: | ||
<toggledisplay linkstyle font-size:larger showtext="[+] Statistics_Definitions.cfg" hidetext="[-] Statistics_Definitions.cfg"> | <toggledisplay linkstyle font-size:larger showtext="[+] Statistics_Definitions.cfg" hidetext="[-] Statistics_Definitions.cfg"> | ||
| Line 32: | Line 29: | ||
name=Productivity | name=Productivity | ||
location=/ | location=/ | ||
| − | notificationFrequency= | + | notificationFrequency=60 |
insensitivity=1 | insensitivity=1 | ||
intervalLength=0 | intervalLength=0 | ||
| Line 52: | Line 49: | ||
name=RejectedChats | name=RejectedChats | ||
location=/ | location=/ | ||
| − | notificationFrequency= | + | notificationFrequency=60 |
insensitivity=1 | insensitivity=1 | ||
category=TotalNumber | category=TotalNumber | ||
| Line 67: | Line 64: | ||
name=CurrentReadyAgents_EXT | name=CurrentReadyAgents_EXT | ||
location=/ | location=/ | ||
| − | notificationFrequency= | + | notificationFrequency=60 |
insensitivity=1 | insensitivity=1 | ||
category=CurrentNumber | category=CurrentNumber | ||
| Line 79: | Line 76: | ||
name=AverageInboundPerHour_EXT | name=AverageInboundPerHour_EXT | ||
location=/ | location=/ | ||
| − | notificationFrequency= | + | notificationFrequency=60 |
insensitivity=1 | insensitivity=1 | ||
intervalLength=0 | intervalLength=0 | ||
| Line 98: | Line 95: | ||
name=HoldDuration | name=HoldDuration | ||
location=/ | location=/ | ||
| − | notificationFrequency= | + | notificationFrequency=60 |
insensitivity=1 | insensitivity=1 | ||
category=TotalAdjustedTime | category=TotalAdjustedTime | ||
| Line 113: | Line 110: | ||
name=ReadyDuration | name=ReadyDuration | ||
location=/ | location=/ | ||
| − | notificationFrequency= | + | notificationFrequency=60 |
insensitivity=1 | insensitivity=1 | ||
category=TotalAdjustedTime | category=TotalAdjustedTime | ||
| Line 128: | Line 125: | ||
name=TransferredChatsToQueue | name=TransferredChatsToQueue | ||
location=/ | location=/ | ||
| − | notificationFrequency= | + | notificationFrequency=60 |
insensitivity=1 | insensitivity=1 | ||
category=TotalNumber | category=TotalNumber | ||
| Line 143: | Line 140: | ||
name=AverageInboundHandlingTime_EXT | name=AverageInboundHandlingTime_EXT | ||
location=/ | location=/ | ||
| − | notificationFrequency= | + | notificationFrequency=60 |
insensitivity=1 | insensitivity=1 | ||
distinguishByConnId=true | distinguishByConnId=true | ||
| Line 159: | Line 156: | ||
name=AverageHandlingTime | name=AverageHandlingTime | ||
location=/ | location=/ | ||
| − | notificationFrequency= | + | notificationFrequency=60 |
insensitivity=1 | insensitivity=1 | ||
intervalLength=0 | intervalLength=0 | ||
| Line 179: | Line 176: | ||
name=AverageOutboundHandlingTime_EXT | name=AverageOutboundHandlingTime_EXT | ||
location=/ | location=/ | ||
| − | notificationFrequency= | + | notificationFrequency=60 |
insensitivity=1 | insensitivity=1 | ||
intervalLength=0 | intervalLength=0 | ||
| Line 218: | Line 215: | ||
name=AverageInboundHandlingTime_EXT | name=AverageInboundHandlingTime_EXT | ||
location=/ | location=/ | ||
| − | notificationFrequency= | + | notificationFrequency=60 |
insensitivity=1 | insensitivity=1 | ||
distinguishByConnId=true | distinguishByConnId=true | ||
| Line 234: | Line 231: | ||
name=TimeInCurrentEmail | name=TimeInCurrentEmail | ||
location=/ | location=/ | ||
| − | notificationFrequency= | + | notificationFrequency=60 |
insensitivity=1 | insensitivity=1 | ||
category=CurrentTime | category=CurrentTime | ||
| Line 244: | Line 241: | ||
objectTypes=Agent | objectTypes=Agent | ||
| − | [statistics.definitions. | + | [statistics.definitions.CurrMaxCallWaitingTime_EXT_GQ] |
| + | name=CurrMaxCallWaitingTime_EXT | ||
| + | location=/ | ||
| + | notificationFrequency=60 | ||
| + | insensitivity=1 | ||
| + | category=CurrentMaxTime | ||
| + | subject=DNAction | ||
| + | mainMask=CallWait | ||
| + | relativeMask=CallWait | ||
| + | notificationMode=Periodical | ||
| + | maskType=ROUTE_POINT | ||
| + | objectTypes=GroupQueues | ||
| + | |||
| + | [statistics.definitions.CurrMaxCallWaitingTime_RP] | ||
name=CurrMaxCallWaitingTime | name=CurrMaxCallWaitingTime | ||
location=/ | location=/ | ||
| − | notificationFrequency= | + | notificationFrequency=60 |
| + | insensitivity=1 | ||
| + | category=CurrentMaxTime | ||
| + | subject=DNAction | ||
| + | mainMask=CallWait | ||
| + | relativeMask=CallWait | ||
| + | dynamicFilter=MediaType=voice | ||
| + | notificationMode=Periodical | ||
| + | maskType=ROUTE_POINT | ||
| + | objectTypes=RoutePoint | ||
| + | |||
| + | [statistics.definitions.CurrMaxCallWaitingTime_EXT2_Q] | ||
| + | name=CurrMaxCallWaitingTime_EXT2 | ||
| + | location=/ | ||
| + | notificationFrequency=60 | ||
insensitivity=1 | insensitivity=1 | ||
category=CurrentMaxTime | category=CurrentMaxTime | ||
| Line 254: | Line 278: | ||
relativeMask=CallWait | relativeMask=CallWait | ||
notificationMode=Periodical | notificationMode=Periodical | ||
| − | |||
maskType=ROUTE_POINT | maskType=ROUTE_POINT | ||
| − | objectTypes= | + | objectTypes=Queue |
[statistics.definitions.TotalInboundCallTime_EXT_GA] | [statistics.definitions.TotalInboundCallTime_EXT_GA] | ||
name=TotalInboundCallTime_EXT | name=TotalInboundCallTime_EXT | ||
location=/ | location=/ | ||
| − | notificationFrequency= | + | notificationFrequency=60 |
insensitivity=1 | insensitivity=1 | ||
category=TotalAdjustedTime | category=TotalAdjustedTime | ||
| Line 275: | Line 298: | ||
name=TotalOutboundCallTime_EXT | name=TotalOutboundCallTime_EXT | ||
location=/ | location=/ | ||
| − | notificationFrequency= | + | notificationFrequency=60 |
insensitivity=1 | insensitivity=1 | ||
category=TotalAdjustedTime | category=TotalAdjustedTime | ||
| Line 289: | Line 312: | ||
name=Total_Abandoned | name=Total_Abandoned | ||
location=/ | location=/ | ||
| − | notificationFrequency= | + | notificationFrequency=60 |
insensitivity=0 | insensitivity=0 | ||
intervalLength=0 | intervalLength=0 | ||
| Line 309: | Line 332: | ||
name=CurrentAgentsOnCall_EXT | name=CurrentAgentsOnCall_EXT | ||
location=/ | location=/ | ||
| − | notificationFrequency= | + | notificationFrequency=60 |
insensitivity=1 | insensitivity=1 | ||
category=CurrentNumber | category=CurrentNumber | ||
| Line 321: | Line 344: | ||
name=AverageOutboundHandlingTime_EXT | name=AverageOutboundHandlingTime_EXT | ||
location=/ | location=/ | ||
| − | notificationFrequency= | + | notificationFrequency=60 |
insensitivity=1 | insensitivity=1 | ||
intervalLength=0 | intervalLength=0 | ||
| Line 340: | Line 363: | ||
name=NotReadyDuration_EXT | name=NotReadyDuration_EXT | ||
location=/ | location=/ | ||
| − | notificationFrequency= | + | notificationFrequency=60 |
insensitivity=1 | insensitivity=1 | ||
category=TotalAdjustedTime | category=TotalAdjustedTime | ||
| Line 354: | Line 377: | ||
name=MissedCalls | name=MissedCalls | ||
location=/ | location=/ | ||
| − | notificationFrequency= | + | notificationFrequency=60 |
insensitivity=1 | insensitivity=1 | ||
intervalLength=9999999 | intervalLength=9999999 | ||
| Line 371: | Line 394: | ||
name=RejectedEmails | name=RejectedEmails | ||
location=/ | location=/ | ||
| − | notificationFrequency= | + | notificationFrequency=60 |
insensitivity=1 | insensitivity=1 | ||
category=TotalNumber | category=TotalNumber | ||
| Line 383: | Line 406: | ||
objectTypes=Agent | objectTypes=Agent | ||
| − | [statistics.definitions. | + | [statistics.definitions.v2v3_AverageWaitingTime_RP] |
name=AverageWaitingTime | name=AverageWaitingTime | ||
location=/ | location=/ | ||
| − | notificationFrequency= | + | notificationFrequency=60 |
insensitivity=1 | insensitivity=1 | ||
intervalLength=0 | intervalLength=0 | ||
| Line 396: | Line 419: | ||
mainMask=CallWait | mainMask=CallWait | ||
relativeMask=CallWait | relativeMask=CallWait | ||
| − | dynamicTimeProfile= | + | dynamicTimeProfile=7:00 |
dynamicFilter=MediaType=voice | dynamicFilter=MediaType=voice | ||
timeRange1=0:0 | timeRange1=0:0 | ||
timeRange2=0:0 | timeRange2=0:0 | ||
notificationMode=Periodical | notificationMode=Periodical | ||
| − | objectTypes= | + | objectTypes=RoutePoint |
| − | [statistics.definitions. | + | [statistics.definitions.v2v3_AverageWaitingTime_EXT_GQ] |
| + | name=AverageWaitingTime_EXT | ||
| + | location=/ | ||
| + | notificationFrequency=60 | ||
| + | insensitivity=1 | ||
| + | intervalLength=0 | ||
| + | distinguishByConnId=false | ||
| + | category=AverageTime | ||
| + | subject=DNAction | ||
| + | intervalType=GrowingWindow | ||
| + | maskType=ROUTE_POINT | ||
| + | mainMask=CallWait | ||
| + | relativeMask=CallWait | ||
| + | dynamicTimeProfile=7:00 | ||
| + | timeRange1=0:0 | ||
| + | timeRange2=0:0 | ||
| + | notificationMode=Periodical | ||
| + | objectTypes=GroupQueues | ||
| + | |||
| + | [statistics.definitions.AverageWaitingTime_EXT2_Q] | ||
| + | name=AverageWaitingTime_EXT2 | ||
| + | location=/ | ||
| + | notificationFrequency=60 | ||
| + | insensitivity=1 | ||
| + | intervalLength=0 | ||
| + | distinguishByConnId=false | ||
| + | category=AverageTime | ||
| + | subject=DNAction | ||
| + | intervalType=GrowingWindow | ||
| + | maskType=ROUTE_POINT | ||
| + | mainMask=CallWait | ||
| + | relativeMask=CallWait | ||
| + | dynamicTimeProfile=07:00 | ||
| + | timeRange1=0:0 | ||
| + | timeRange2=0:0 | ||
| + | notificationMode=Periodical | ||
| + | objectTypes=Queue | ||
| + | |||
| + | [statistics.definitions.CurrentInQueue_EXT_GQ] | ||
name=CurrentInQueue_EXT | name=CurrentInQueue_EXT | ||
location=/ | location=/ | ||
| − | notificationFrequency= | + | notificationFrequency=60 |
| + | insensitivity=1 | ||
| + | category=CurrentNumber | ||
| + | subject=DNAction | ||
| + | mainMask=CallWait | ||
| + | notificationMode=Periodical | ||
| + | maskType=ROUTE_POINT | ||
| + | objectTypes=GroupQueues | ||
| + | |||
| + | [statistics.definitions.CurrentInQueue_EXT2_Q] | ||
| + | name=CurrentInQueue_EXT2 | ||
| + | location=/ | ||
| + | notificationFrequency=60 | ||
insensitivity=1 | insensitivity=1 | ||
category=CurrentNumber | category=CurrentNumber | ||
| Line 413: | Line 486: | ||
notificationMode=Periodical | notificationMode=Periodical | ||
maskType=ROUTE_POINT | maskType=ROUTE_POINT | ||
| − | objectTypes=Queue | + | objectTypes=Queue |
[statistics.definitions.Productivity_Email_A] | [statistics.definitions.Productivity_Email_A] | ||
name=Productivity_Email | name=Productivity_Email | ||
location=/ | location=/ | ||
| − | notificationFrequency= | + | notificationFrequency=60 |
insensitivity=1 | insensitivity=1 | ||
category=AverageNumberPerRelativeHour | category=AverageNumberPerRelativeHour | ||
| Line 434: | Line 507: | ||
name=OutboundEmails | name=OutboundEmails | ||
location=/ | location=/ | ||
| − | notificationFrequency= | + | notificationFrequency=60 |
insensitivity=1 | insensitivity=1 | ||
category=TotalNumber | category=TotalNumber | ||
| Line 449: | Line 522: | ||
name=Total_Queue_Inbound | name=Total_Queue_Inbound | ||
location=/ | location=/ | ||
| − | notificationFrequency= | + | notificationFrequency=60 |
insensitivity=1 | insensitivity=1 | ||
category=TotalNumber | category=TotalNumber | ||
| Line 464: | Line 537: | ||
name=MissedEmails | name=MissedEmails | ||
location=/ | location=/ | ||
| − | notificationFrequency= | + | notificationFrequency=60 |
insensitivity=1 | insensitivity=1 | ||
category=TotalNumber | category=TotalNumber | ||
| Line 479: | Line 552: | ||
name=TotalCallsOutbound_EXT | name=TotalCallsOutbound_EXT | ||
location=/ | location=/ | ||
| − | notificationFrequency= | + | notificationFrequency=60 |
insensitivity=1 | insensitivity=1 | ||
category=TotalAdjustedNumber | category=TotalAdjustedNumber | ||
| Line 493: | Line 566: | ||
name=TotalCallsInbound_EXT | name=TotalCallsInbound_EXT | ||
location=/ | location=/ | ||
| − | notificationFrequency= | + | notificationFrequency=60 |
insensitivity=1 | insensitivity=1 | ||
category=TotalAdjustedNumber | category=TotalAdjustedNumber | ||
| Line 507: | Line 580: | ||
name=AverageOutboundPerHour_EXT | name=AverageOutboundPerHour_EXT | ||
location=/ | location=/ | ||
| − | notificationFrequency= | + | notificationFrequency=60 |
insensitivity=1 | insensitivity=1 | ||
intervalLength=0 | intervalLength=0 | ||
| Line 523: | Line 596: | ||
objectTypes=GroupAgents | objectTypes=GroupAgents | ||
| − | [statistics.definitions. | + | [statistics.definitions.CallsAbandoned_EXT_GQ] |
name=CallsAbandoned_EXT | name=CallsAbandoned_EXT | ||
location=/ | location=/ | ||
| − | notificationFrequency= | + | notificationFrequency=60 |
| + | insensitivity=1 | ||
| + | intervalLength=0 | ||
| + | distinguishByConnId=false | ||
| + | category=TotalNumber | ||
| + | subject=DNAction | ||
| + | intervalType=GrowingWindow | ||
| + | maskType=ROUTE_POINT | ||
| + | mainMask=CallAbandoned, CallAbandonedFromRinging | ||
| + | relativeMask=CallAbandoned, CallAbandonedFromRinging | ||
| + | dynamicTimeProfile=7:00 | ||
| + | timeRange1=0:0 | ||
| + | timeRange2=0:0 | ||
| + | notificationMode=Periodical | ||
| + | objectTypes=GroupQueues | ||
| + | |||
| + | [statistics.definitions.CallsAbandoned_EXT2_Q] | ||
| + | name=CallsAbandoned_EXT2 | ||
| + | location=/ | ||
| + | notificationFrequency=60 | ||
insensitivity=1 | insensitivity=1 | ||
intervalLength=0 | intervalLength=0 | ||
| Line 536: | Line 628: | ||
mainMask=CallAbandoned, CallAbandonedFromRinging | mainMask=CallAbandoned, CallAbandonedFromRinging | ||
relativeMask=CallAbandoned, CallAbandonedFromRinging | relativeMask=CallAbandoned, CallAbandonedFromRinging | ||
| − | dynamicTimeProfile= | + | dynamicTimeProfile=07:00 |
timeRange1=0:0 | timeRange1=0:0 | ||
timeRange2=0:0 | timeRange2=0:0 | ||
notificationMode=Periodical | notificationMode=Periodical | ||
| − | objectTypes=Queue | + | objectTypes=Queue |
[statistics.definitions.TotalCallsRinging_EXT_A] | [statistics.definitions.TotalCallsRinging_EXT_A] | ||
name=TotalCallsRinging_EXT | name=TotalCallsRinging_EXT | ||
location=/ | location=/ | ||
| − | notificationFrequency= | + | notificationFrequency=60 |
insensitivity=1 | insensitivity=1 | ||
category=TotalAdjustedNumber | category=TotalAdjustedNumber | ||
| Line 559: | Line 651: | ||
name=Total_Answered | name=Total_Answered | ||
location=/ | location=/ | ||
| − | notificationFrequency= | + | notificationFrequency=60 |
insensitivity=0 | insensitivity=0 | ||
category=TotalNumber | category=TotalNumber | ||
| Line 574: | Line 666: | ||
name=ConsultCalls | name=ConsultCalls | ||
location=/ | location=/ | ||
| − | notificationFrequency= | + | notificationFrequency=60 |
insensitivity=1 | insensitivity=1 | ||
intervalLength=0 | intervalLength=0 | ||
| Line 594: | Line 686: | ||
name=CallsInboundRinging_EXT | name=CallsInboundRinging_EXT | ||
location=/ | location=/ | ||
| − | notificationFrequency= | + | notificationFrequency=60 |
insensitivity=1 | insensitivity=1 | ||
category=TotalAdjustedNumber | category=TotalAdjustedNumber | ||
| Line 608: | Line 700: | ||
name=ReadyDuration_Chat | name=ReadyDuration_Chat | ||
location=/ | location=/ | ||
| − | notificationFrequency= | + | notificationFrequency=60 |
insensitivity=1 | insensitivity=1 | ||
category=TotalAdjustedTime | category=TotalAdjustedTime | ||
| Line 623: | Line 715: | ||
name=CallsEntered_EXT2 | name=CallsEntered_EXT2 | ||
location=/ | location=/ | ||
| − | notificationFrequency= | + | notificationFrequency=60 |
insensitivity=1 | insensitivity=1 | ||
distinguishByConnId=true | distinguishByConnId=true | ||
| Line 638: | Line 730: | ||
name=InboundChats | name=InboundChats | ||
location=/ | location=/ | ||
| − | notificationFrequency= | + | notificationFrequency=60 |
insensitivity=1 | insensitivity=1 | ||
intervalLength=0 | intervalLength=0 | ||
| Line 658: | Line 750: | ||
name=TimeInCurrentState | name=TimeInCurrentState | ||
location=/ | location=/ | ||
| − | notificationFrequency= | + | notificationFrequency=60 |
insensitivity=1 | insensitivity=1 | ||
category=CurrentTime | category=CurrentTime | ||
| Line 671: | Line 763: | ||
name=TotalInboundCallTime_EXT | name=TotalInboundCallTime_EXT | ||
location=/ | location=/ | ||
| − | notificationFrequency= | + | notificationFrequency=60 |
insensitivity=1 | insensitivity=1 | ||
category=TotalAdjustedTime | category=TotalAdjustedTime | ||
| Line 685: | Line 777: | ||
name=InboundEmails | name=InboundEmails | ||
location=/ | location=/ | ||
| − | notificationFrequency= | + | notificationFrequency=60 |
insensitivity=1 | insensitivity=1 | ||
category=TotalNumber | category=TotalNumber | ||
| Line 700: | Line 792: | ||
name=TalkDuration | name=TalkDuration | ||
location=/ | location=/ | ||
| − | notificationFrequency= | + | notificationFrequency=60 |
insensitivity=1 | insensitivity=1 | ||
category=TotalAdjustedTime | category=TotalAdjustedTime | ||
| Line 711: | Line 803: | ||
maskType=DN | maskType=DN | ||
objectTypes=Agent | objectTypes=Agent | ||
| − | |||
| − | |||
| − | |||
[statistics.definitions.WrapDuration_A] | [statistics.definitions.WrapDuration_A] | ||
name=WrapDuration | name=WrapDuration | ||
location=/ | location=/ | ||
| − | notificationFrequency= | + | notificationFrequency=60 |
insensitivity=1 | insensitivity=1 | ||
intervalLength=0 | intervalLength=0 | ||
| Line 738: | Line 827: | ||
name=ChatCurrentInQueue | name=ChatCurrentInQueue | ||
location=/ | location=/ | ||
| − | notificationFrequency= | + | notificationFrequency=60 |
insensitivity=0 | insensitivity=0 | ||
intervalLength=0 | intervalLength=0 | ||
| Line 758: | Line 847: | ||
name=AverageInboundPerHour_EXT | name=AverageInboundPerHour_EXT | ||
location=/ | location=/ | ||
| − | notificationFrequency= | + | notificationFrequency=60 |
insensitivity=1 | insensitivity=1 | ||
distinguishByConnId=true | distinguishByConnId=true | ||
| Line 774: | Line 863: | ||
name=TotalCallsOutbound_EXT | name=TotalCallsOutbound_EXT | ||
location=/ | location=/ | ||
| − | notificationFrequency= | + | notificationFrequency=60 |
insensitivity=1 | insensitivity=1 | ||
category=TotalAdjustedNumber | category=TotalAdjustedNumber | ||
| Line 788: | Line 877: | ||
name=TotalCallsInbound_EXT | name=TotalCallsInbound_EXT | ||
location=/ | location=/ | ||
| − | notificationFrequency= | + | notificationFrequency=60 |
insensitivity=1 | insensitivity=1 | ||
category=TotalAdjustedNumber | category=TotalAdjustedNumber | ||
| Line 802: | Line 891: | ||
name=CallsEntered_EXT | name=CallsEntered_EXT | ||
location=/ | location=/ | ||
| − | notificationFrequency= | + | notificationFrequency=60 |
insensitivity=1 | insensitivity=1 | ||
distinguishByConnId=true | distinguishByConnId=true | ||
| Line 828: | Line 917: | ||
name=CurrAvgCallWaitingTime | name=CurrAvgCallWaitingTime | ||
location=/ | location=/ | ||
| − | notificationFrequency= | + | notificationFrequency=60 |
insensitivity=1 | insensitivity=1 | ||
category=CurrentAverageTime | category=CurrentAverageTime | ||
| Line 842: | Line 931: | ||
name=CallsInboundRinging_EXT | name=CallsInboundRinging_EXT | ||
location=/ | location=/ | ||
| − | notificationFrequency= | + | notificationFrequency=60 |
insensitivity=1 | insensitivity=1 | ||
category=TotalAdjustedNumber | category=TotalAdjustedNumber | ||
| Line 856: | Line 945: | ||
name=OutboundCalls | name=OutboundCalls | ||
location=/ | location=/ | ||
| − | notificationFrequency= | + | notificationFrequency=60 |
insensitivity=1 | insensitivity=1 | ||
intervalLength=0 | intervalLength=0 | ||
| Line 876: | Line 965: | ||
name=TransferredEmailsToQueue | name=TransferredEmailsToQueue | ||
location=/ | location=/ | ||
| − | notificationFrequency= | + | notificationFrequency=60 |
insensitivity=1 | insensitivity=1 | ||
category=TotalNumber | category=TotalNumber | ||
| Line 891: | Line 980: | ||
name=LoginDuration_EXT | name=LoginDuration_EXT | ||
location=/ | location=/ | ||
| − | notificationFrequency= | + | notificationFrequency=60 |
insensitivity=1 | insensitivity=1 | ||
category=TotalTime | category=TotalTime | ||
| Line 905: | Line 994: | ||
name=CurrentLoggedInAgents_EXT | name=CurrentLoggedInAgents_EXT | ||
location=/ | location=/ | ||
| − | notificationFrequency= | + | notificationFrequency=60 |
insensitivity=1 | insensitivity=1 | ||
category=CurrentNumber | category=CurrentNumber | ||
| Line 914: | Line 1,003: | ||
objectTypes=GroupAgents | objectTypes=GroupAgents | ||
| − | [statistics.definitions. | + | [statistics.definitions.CallsAnswered_EXT_GQ] |
name=CallsAnswered_EXT | name=CallsAnswered_EXT | ||
location=/ | location=/ | ||
| − | notificationFrequency= | + | notificationFrequency=60 |
| + | insensitivity=1 | ||
| + | intervalLength=0 | ||
| + | distinguishByConnId=true | ||
| + | category=TotalNumber | ||
| + | subject=DNAction | ||
| + | intervalType=GrowingWindow | ||
| + | maskType=ROUTE_POINT | ||
| + | mainMask=CallAnswered | ||
| + | relativeMask=CallAnswered | ||
| + | dynamicTimeProfile=7:00 | ||
| + | timeRange1=0:0 | ||
| + | timeRange2=0:0 | ||
| + | notificationMode=Periodical | ||
| + | objectTypes=GroupQueues | ||
| + | |||
| + | [statistics.definitions.CallsAnswered_EXT2_Q] | ||
| + | name=CallsAnswered_EXT2 | ||
| + | location=/ | ||
| + | notificationFrequency=60 | ||
insensitivity=1 | insensitivity=1 | ||
intervalLength=0 | intervalLength=0 | ||
| Line 927: | Line 1,035: | ||
mainMask=CallAnswered | mainMask=CallAnswered | ||
relativeMask=CallAnswered | relativeMask=CallAnswered | ||
| − | dynamicTimeProfile= | + | dynamicTimeProfile=07:00 |
timeRange1=0:0 | timeRange1=0:0 | ||
timeRange2=0:0 | timeRange2=0:0 | ||
notificationMode=Periodical | notificationMode=Periodical | ||
| − | objectTypes= | + | objectTypes=Queue |
[statistics.definitions.ChatAccepted_Q] | [statistics.definitions.ChatAccepted_Q] | ||
name=ChatAccepted | name=ChatAccepted | ||
location=/ | location=/ | ||
| − | notificationFrequency= | + | notificationFrequency=60 |
insensitivity=0 | insensitivity=0 | ||
intervalLength=0 | intervalLength=0 | ||
| Line 956: | Line 1,064: | ||
name=TotalOutboundCallTime_EXT | name=TotalOutboundCallTime_EXT | ||
location=/ | location=/ | ||
| − | notificationFrequency= | + | notificationFrequency=60 |
insensitivity=1 | insensitivity=1 | ||
category=TotalAdjustedTime | category=TotalAdjustedTime | ||
| Line 970: | Line 1,078: | ||
name=TransferredEmails | name=TransferredEmails | ||
location=/ | location=/ | ||
| − | notificationFrequency= | + | notificationFrequency=60 |
insensitivity=1 | insensitivity=1 | ||
category=TotalNumber | category=TotalNumber | ||
| Line 985: | Line 1,093: | ||
name=InboundCalls | name=InboundCalls | ||
location=/ | location=/ | ||
| − | notificationFrequency= | + | notificationFrequency=60 |
insensitivity=1 | insensitivity=1 | ||
intervalLength=0 | intervalLength=0 | ||
| Line 1,005: | Line 1,113: | ||
name=InternalCalls | name=InternalCalls | ||
location=/ | location=/ | ||
| − | notificationFrequency= | + | notificationFrequency=60 |
insensitivity=1 | insensitivity=1 | ||
category=TotalNumber | category=TotalNumber | ||
| Line 1,020: | Line 1,128: | ||
name=Current_In_Queue | name=Current_In_Queue | ||
location=/ | location=/ | ||
| − | notificationFrequency= | + | notificationFrequency=60 |
insensitivity=1 | insensitivity=1 | ||
category=CurrentNumber | category=CurrentNumber | ||
| Line 1,033: | Line 1,141: | ||
name=MissedChats | name=MissedChats | ||
location=/ | location=/ | ||
| − | notificationFrequency= | + | notificationFrequency=60 |
insensitivity=1 | insensitivity=1 | ||
category=TotalNumber | category=TotalNumber | ||
| Line 1,048: | Line 1,156: | ||
name=Current_In_Queue | name=Current_In_Queue | ||
location=/ | location=/ | ||
| − | notificationFrequency= | + | notificationFrequency=60 |
insensitivity=1 | insensitivity=1 | ||
category=CurrentNumber | category=CurrentNumber | ||
| Line 1,061: | Line 1,169: | ||
name=ReadyDuration_Email | name=ReadyDuration_Email | ||
location=/ | location=/ | ||
| − | notificationFrequency= | + | notificationFrequency=60 |
insensitivity=1 | insensitivity=1 | ||
category=TotalAdjustedTime | category=TotalAdjustedTime | ||
| Line 1,076: | Line 1,184: | ||
name=Productivity_Chat | name=Productivity_Chat | ||
location=/ | location=/ | ||
| − | notificationFrequency= | + | notificationFrequency=60 |
insensitivity=1 | insensitivity=1 | ||
category=AverageNumberPerRelativeHour | category=AverageNumberPerRelativeHour | ||
| Line 1,092: | Line 1,200: | ||
name=AverageHandlingTime_Email | name=AverageHandlingTime_Email | ||
location=/ | location=/ | ||
| − | notificationFrequency= | + | notificationFrequency=60 |
insensitivity=1 | insensitivity=1 | ||
intervalLength=0 | intervalLength=0 | ||
| Line 1,112: | Line 1,220: | ||
name=ChatDuration | name=ChatDuration | ||
location=/ | location=/ | ||
| − | notificationFrequency= | + | notificationFrequency=60 |
insensitivity=1 | insensitivity=1 | ||
intervalLength=0 | intervalLength=0 | ||
| Line 1,145: | Line 1,253: | ||
name=EmailDuration | name=EmailDuration | ||
location=/ | location=/ | ||
| − | notificationFrequency= | + | notificationFrequency=60 |
insensitivity=1 | insensitivity=1 | ||
category=TotalAdjustedTime | category=TotalAdjustedTime | ||
| Line 1,160: | Line 1,268: | ||
name=TransferredChats | name=TransferredChats | ||
location=/ | location=/ | ||
| − | notificationFrequency= | + | notificationFrequency=60 |
insensitivity=1 | insensitivity=1 | ||
category=TotalNumber | category=TotalNumber | ||
| Line 1,175: | Line 1,283: | ||
name=AverageOutboundPerHour_EXT | name=AverageOutboundPerHour_EXT | ||
location=/ | location=/ | ||
| − | notificationFrequency= | + | notificationFrequency=60 |
insensitivity=1 | insensitivity=1 | ||
intervalLength=0 | intervalLength=0 | ||
| Line 1,197: | Line 1,305: | ||
{{AnchorDiv|KPIs}} | {{AnchorDiv|KPIs}} | ||
==KPIs== | ==KPIs== | ||
| − | To display statistics (KPIs) in the '''Performance Tracker''' view of the Workspace interface, you must specify at least one statistic in the {{Optionslink|link=Options: | + | To display statistics (KPIs) in the '''Performance Tracker''' view of the Workspace interface, you must specify at least one statistic in the {{Optionslink|link=Options:Genesys_Web_Services:interaction-workspace:kpi-displayed-kpis}} option and grant the {{Optionslink|link=Options:Genesys_Web_Services:interaction-workspace:privilege-performance-tracker-can-use}} privilege. |
The following is an example of how to create, modify, and specify the <tt>InternalCalls</tt> statistic for display. | The following is an example of how to create, modify, and specify the <tt>InternalCalls</tt> statistic for display. | ||
| Line 1,222: | Line 1,330: | ||
<ol> | <ol> | ||
<li>Choose a statistic that you want to display. For this example we will use '''InternalCalls'''.</li> | <li>Choose a statistic that you want to display. For this example we will use '''InternalCalls'''.</li> | ||
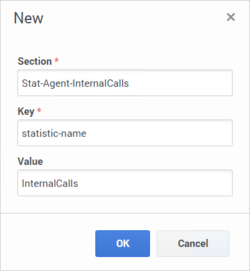
| − | <li>Create a section in the <tt> | + | <li>Create a section in the <tt>GWS Application Server object</tt> application object by using Genesys Administrator Extension, such as <tt>Stat-Agent-InternalCalls</tt>, for the '''Key''' specify the <tt>statistic-name</tt> option and assign <tt>InternalCalls</tt> as the value: |
<br> | <br> | ||
| − | [[File: | + | [[File:GAPI_900_KPI_Create_New_Option.png|Center|250px]] |
</li> | </li> | ||
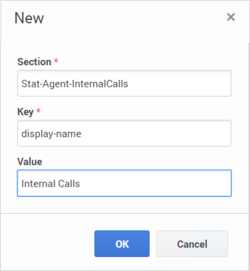
| − | <li>Create an option in the section called <tt> | + | <li>(Recommended) Create an option in the section called <tt>Stat-Agent-InternalCalls</tt> and assign <tt>display-name</tt> as the key and <tt>Internal Calls</tt> as the value: |
<br> | <br> | ||
| − | [[File: | + | [[File:GAPI_900_KPI_Create_New_Section.png|Center|250px]] |
</li> | </li> | ||
| − | <li>(Optional) | + | <li>(Optional) The statistics attributes (options) that you can specify for a statistics section include: |
| − | |||
| − | The statistics attributes (options) that you can specify for a statistics section include: | ||
<ul> | <ul> | ||
<li>statistic-name (mandatory)</li> | <li>statistic-name (mandatory)</li> | ||
| + | <li>display-name (recommended)</li> | ||
<li>target-value</li> | <li>target-value</li> | ||
<li>warning-level-low</li> | <li>warning-level-low</li> | ||
| Line 1,250: | Line 1,357: | ||
</li> | </li> | ||
<li>Repeat steps 1 through 5 for each statistic that you want to use.</li> | <li>Repeat steps 1 through 5 for each statistic that you want to use.</li> | ||
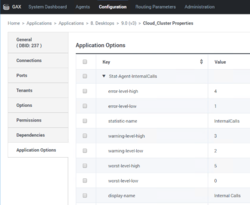
| − | <li>To make the statistic display in the '''Performance Tracker''', specify the section name in the {{Optionslink|link=Options: | + | <li>To make the statistic display in the '''Performance Tracker''', specify the section name in the {{Optionslink|link=Options:Genesys_Web_Services:interaction-workspace:kpi-displayed-kpis}} option in the '''interaction-workspace''' section of the <tt>GWS Application Server object</tt> application object. You can also specify this option at the agent, agent group, or skill level. |
<br> | <br> | ||
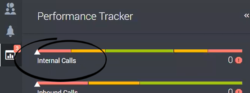
[[File:GAPI_900_KPI_Performance_Tracker_Example.png|Center|250px]] | [[File:GAPI_900_KPI_Performance_Tracker_Example.png|Center|250px]] | ||
| Line 1,263: | Line 1,370: | ||
==Contact Center Statistics== | ==Contact Center Statistics== | ||
| − | To display contact center statistics in the '''Dashboard''' tab of the Workspace | + | To display contact center statistics in the '''Dashboard''' tab of the Agent Workspace interface, you must specify at least one statistic in the {{Optionslink|link=Options:Genesys_Web_Services:interaction-workspace:statistics-displayed-statistics}} option and grant the {{Optionslink|link=Options:Genesys_Web_Services:interaction-workspace:privilege-monitor-dashboard-can-use}} privilege. |
The following is an example of how to specify the '''AverageWaitingTime''' statistic for display. | The following is an example of how to specify the '''AverageWaitingTime''' statistic for display. | ||
| Line 1,270: | Line 1,377: | ||
<source lang="text"> | <source lang="text"> | ||
| − | [statistics.definitions. | + | [statistics.definitions.v2v3_AverageWaitingTime_RP] |
name=AverageWaitingTime | name=AverageWaitingTime | ||
location=/ | location=/ | ||
| − | notificationFrequency= | + | notificationFrequency=60 |
insensitivity=1 | insensitivity=1 | ||
intervalLength=0 | intervalLength=0 | ||
| Line 1,283: | Line 1,390: | ||
mainMask=CallWait | mainMask=CallWait | ||
relativeMask=CallWait | relativeMask=CallWait | ||
| − | dynamicTimeProfile= | + | dynamicTimeProfile=7:00 |
dynamicFilter=MediaType=voice | dynamicFilter=MediaType=voice | ||
timeRange1=0:0 | timeRange1=0:0 | ||
timeRange2=0:0 | timeRange2=0:0 | ||
notificationMode=Periodical | notificationMode=Periodical | ||
| − | objectTypes= | + | objectTypes=RoutePoint |
</source> | </source> | ||
<ol> | <ol> | ||
<li>Choose a statistic that you want to display. In this example we will use '''AverageWaitingTime'''.</li> | <li>Choose a statistic that you want to display. In this example we will use '''AverageWaitingTime'''.</li> | ||
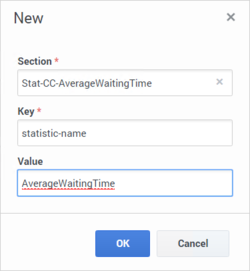
| − | <li>Create a section in the <tt> | + | <li>Create a section in the <tt>GWS Application Server object</tt> application object by using Genesys Administrator Extension, such as <tt>Stat-CC-AverageWaitingTime</tt>, for the '''Key''' specify the <tt>statistic-name</tt> option and assign <li>Assign '''AverageWaitingTime''' as the value. |
| − | <li>Assign '''AverageWaitingTime''' as the value. | ||
<br> | <br> | ||
[[File:GAPI_900_Stat-CC_Create_New_Section.png|Center|250px]] | [[File:GAPI_900_Stat-CC_Create_New_Section.png|Center|250px]] | ||
</li> | </li> | ||
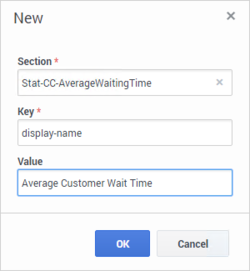
| − | <li>( | + | <li>(Recommended) Create an option in the section called <tt>Stat-CC-AverageWaitingTime</tt> and assign <tt>display-name</tt> as the key and <tt>Average Customer Wait Time</tt> as the value: |
<br> | <br> | ||
| − | The attributes that you can specify include: | + | [[File:GAPI_900_Stat-CC_Create_New_Option.png|Center|250px]] |
| + | </li> | ||
| + | <li>(Optional) The statistics attributes (options) that you can specify for a statistics section include:: | ||
<ul> | <ul> | ||
| − | <li>statistic-name(mandatory)</li> | + | <li>statistic-name (mandatory)</li> |
| + | <li>display-name (recommended)</li> | ||
<li>target-value</li> | <li>target-value</li> | ||
<li>warning-level-low</li> | <li>warning-level-low</li> | ||
| Line 1,315: | Line 1,424: | ||
Refer to [[EnablingAgentstoViewKPIs#SettingLevels|Setting the Warning, Error, and Worst Levels]] for more information about how to use the target, warning, error, and worst attributes.</li> | Refer to [[EnablingAgentstoViewKPIs#SettingLevels|Setting the Warning, Error, and Worst Levels]] for more information about how to use the target, warning, error, and worst attributes.</li> | ||
<li>Repeat steps 1 through 5 for each statistic that you want to use.</li> | <li>Repeat steps 1 through 5 for each statistic that you want to use.</li> | ||
| − | <li>In the '''interaction-workspace''' section in the <tt> | + | <li>In the '''interaction-workspace''' section in the <tt>GWS Application Server object</tt> application, specify the name of the section that you created in Step 2 as one of the values of the {{Optionslink|link=Options:Genesys_Web_Services:interaction-workspace:statistics-displayed-statistics}} option. The value of this option is a coma-separated list of section names defined in the <tt>GWS Application Server object</tt> application. Specify the statistics in the order in which you want the statistics to be displayed in the Workspace interface. For example: <tt>Stat-CC-AverageWaitingTime,Stat-CC-Current_In_Queue,Stat-CC-CurrMaxCallWaitingTime,Stat-CC-ServiceLevel,Stat-CC-Total_Abandoned,Stat-CC-Total_Answered</tt></li> |
<li>Specify the queue group, agent group, routing point, and/or virtual queue for which you want statistics reported by using the following options: | <li>Specify the queue group, agent group, routing point, and/or virtual queue for which you want statistics reported by using the following options: | ||
<ul> | <ul> | ||
| − | <li>{{Optionslink|link=Options: | + | <li>{{Optionslink|link=Options:Genesys_Web_Services:interaction-workspace:statistics-queue-groups}}</li> |
| − | <li>{{Optionslink|link=Options: | + | <li>{{Optionslink|link=Options:Genesys_Web_Services:interaction-workspace:statistics-agent-groups}}</li> |
| − | <li>{{Optionslink|link=Options: | + | <li>{{Optionslink|link=Options:Genesys_Web_Services:interaction-workspace:statistics-routing-points}}</li> |
| − | <li>{{Optionslink|link=Options: | + | <li>{{Optionslink|link=Options:Genesys_Web_Services:interaction-workspace:statistics-virtual-queues}}</li> |
</ul> | </ul> | ||
</li> | </li> | ||
| − | <li>Use the <tt>{{Optionslink|link=Options: | + | <li>Use the <tt>{{Optionslink|link=Options:Genesys_Web_Services:interaction-workspace:permissions-agent-group-exclude}}</tt> option to specify the list of agent groups or virtual agent groups to be excluded from Statistics, |
| − | or use the <tt>{{Optionslink|link=Options: | + | or use the <tt>{{Optionslink|link=Options:Genesys_Web_Services:interaction-workspace:permissions-agent-group-restrict}}</tt> option to specify the list of agent groups or virtual agent groups to which Statistics are restricted.</li> |
| − | <li>Specify the refresh time, in seconds, for the statistics in the '''Contact Center Statistics''' tab by using the <tt>{{Optionslink|link=Options: | + | <li>Specify the refresh time, in seconds, for the statistics in the '''Contact Center Statistics''' tab by using the <tt>{{Optionslink|link=Options:Genesys_Web_Services:interaction-workspace:statistics-refresh-time}}</tt> option.</li> |
</ol> | </ol> | ||
{{AnchorDiv|SettingLevels}} | {{AnchorDiv|SettingLevels}} | ||
| Line 1,347: | Line 1,456: | ||
* <tt>worst-value-high</tt>: Values above this value result in a negative evaluation for the KPI. | * <tt>worst-value-high</tt>: Values above this value result in a negative evaluation for the KPI. | ||
* <tt>target-value</tt>: The target value to be reached by the agent. | * <tt>target-value</tt>: The target value to be reached by the agent. | ||
| − | |||
| − | |||
| − | |||
| − | |||
| − | |||
| − | |||
| − | |||
| − | |||
| − | |||
| − | |||
| − | |||
| − | |||
These options control when the following icons are displayed in the '''Dashboard''' (Contact Center Statistics) region and '''Performance Tracker''' (KPI) view: | These options control when the following icons are displayed in the '''Dashboard''' (Contact Center Statistics) region and '''Performance Tracker''' (KPI) view: | ||
| − | * A worst icon ([[File:WWE_852_KPI_Error_Icon.png|link=]]) is displayed if the evaluation of the performance is below the expected worst level for the agent statistic (KPI) or contact center statistic. | + | * A worst icon ([[File:WWE_852_KPI_Error_Icon.png|link=]]) is displayed if the evaluation of the performance is below the expected worst low level or above the worst high level for the agent statistic (KPI) or contact center statistic. |
| − | * An error icon ([[File:IW_KPI_Alert_Icon_850.png|link=]]) is displayed if the evaluation of the performance is below the expected error level for the agent statistic (KPI) or contact center statistic. | + | * An error icon ([[File:IW_KPI_Alert_Icon_850.png|link=]]) is displayed if the evaluation of the performance is below the expected error low level or above the error high level for the agent statistic (KPI) or contact center statistic. |
| − | * A warning icon ([[File:IW_KPI_Warning_Icon_850.png|link=]]) is displayed if the evaluation of your performance for the agent statistic (KPI) or contact center statistic | + | * A warning icon ([[File:IW_KPI_Warning_Icon_850.png|link=]]) is displayed if the evaluation of your performance for the agent statistic (KPI) or contact center statistic is below the expected warning low level or above the warning high level. |
In the '''Performance Tracker''' view they also configure the appearance of the statistic indicator bars, for example: | In the '''Performance Tracker''' view they also configure the appearance of the statistic indicator bars, for example: | ||
| Line 1,368: | Line 1,465: | ||
[[File:GAPI_900_Warning_Error_Target_Values.png|Center|500px]] | [[File:GAPI_900_Warning_Error_Target_Values.png|Center|500px]] | ||
| − | |||
| − | |||
| − | |||
| − | |||
| − | |||
| − | |||
| − | |||
| − | |||
| − | |||
| − | |||
| − | |||
| − | |||
| − | |||
| − | |||
| − | |||
| − | |||
| − | |||
| − | |||
| − | |||
| − | |||
| − | |||
| − | |||
| − | |||
| − | |||
| − | |||
| − | |||
| − | |||
| − | |||
| − | |||
| − | |||
| − | |||
| − | |||
| − | |||
| − | |||
| − | |||
| − | |||
| − | |||
| − | |||
| − | |||
| − | |||
| − | |||
| − | |||
| − | |||
| − | |||
| − | |||
| − | |||
| − | |||
| − | |||
| − | |||
| − | |||
| − | |||
| − | |||
| − | |||
| − | |||
| − | |||
| − | |||
| − | |||
| − | |||
| − | |||
| − | |||
| − | |||
| − | |||
| − | |||
| − | |||
| − | |||
| − | |||
| − | |||
{{AnchorDiv|StatisticsGadget}} | {{AnchorDiv|StatisticsGadget}} | ||
| − | |||
| − | |||
==Statistics Gadget== | ==Statistics Gadget== | ||
| − | |||
| − | |||
The Workspace Statistics Gadget enables your agents to constantly monitor key statistics that you specify. You can specify one or more statistics to be displayed to the agent at all times in the Main Menu bar of the Workspace window. | The Workspace Statistics Gadget enables your agents to constantly monitor key statistics that you specify. You can specify one or more statistics to be displayed to the agent at all times in the Main Menu bar of the Workspace window. | ||
| − | The Contact Center Statistics and | + | The '''Contact Center Statistics''' tab and '''Performance Tracker''' enable agents to view all the statistics and KPIs that you define; however, to view these, the agent must open those tabs, which temporarily hides the rest of the Workspace window. |
| − | Refer to the Workspace Help for information about using the [[Documentation: | + | Refer to the Workspace Help for information about using the [[Documentation:PSAAS:Agent:ADNav#StatisticsGadget|Statistic Gadget]]. |
| − | Use the {{Optionslink|link=Options: | + | Use the {{Optionslink|link=Options:Genesys_Web_Services:interaction-workspace:statistics-gadget-statistics}} option to specify a section or sections that contain a statistic or statistics to be displayed in the Statistics Gadget. If more than one statistic is specified, the first one is displayed by default. The others can be displayed by hovering the mouse pointer over the gadget or by clicking the gadget to open a menu that enables selection of a different statistic. |
| − | Use the {{Optionslink|link=Options: | + | Use the {{Optionslink|link=Options:Genesys_Web_Services:interaction-workspace:statistics-gadget-statistics-max-size}} option to specify the maximum number of statistics that can be displayed in the Statistics Gadget. If you specify a number of statistics in the '''statistics.gadget-statistics''' option that exceeds this number, only the first ''n'' statistics are displayed. |
===Configuring the statistics.gadget-statistics option=== | ===Configuring the statistics.gadget-statistics option=== | ||
| − | The {{Optionslink|link=Options: | + | The {{Optionslink|link=Options:Genesys_Web_Services:interaction-workspace:statistics-gadget-statistics}} option enables you to specify statistic sections to be displayed. The section should contain the name of the statistics definition, specified by the '''statistic-definitions''' option and the list of objects for which the statistic should be displayed (in the '''object-ids''' option) and the type of the object (in the '''object-type''' option). The list of objects in '''object-ids''' should all be from the same type (for example, Agent Groups), and this type of object should be specified in the '''object-type''' option. |
You can also specify the following options in the statistic section to add the name and the type of the statistic: | You can also specify the following options in the statistic section to add the name and the type of the statistic: | ||
| − | * | + | * object-ids: The ids of Agent Groups, Virtual Queues, DN Groups, and Routing Points |
| − | * | + | * object-type: Statistics can be displayed for four different types of objects: |
** Agent Group — Statistics for an agent group or virtual agent group | ** Agent Group — Statistics for an agent group or virtual agent group | ||
** Routing Point — Statistics for a Routing Point | ** Routing Point — Statistics for a Routing Point | ||
| Line 1,464: | Line 1,490: | ||
Valid values for this option are the names of sections that you have defined that contain the definitions of statistics, such as the name of the statistic, the name of the object for which the statistic is calculated, object type, object id, and so on. | Valid values for this option are the names of sections that you have defined that contain the definitions of statistics, such as the name of the statistic, the name of the object for which the statistic is calculated, object type, object id, and so on. | ||
| − | * Agent Statistic — If the statistic section is defined only with a | + | * Agent Statistic — If the statistic section is defined only with a '''statistic-name''' option, the statistic is considered as a statistic for the currently logged-in agent. |
| − | * Routing Point Statistic — The statistic section is defined with the | + | * Routing Point Statistic — The statistic section is defined with the '''object-type''' option as '''RoutingPoint'''. |
| − | * Virtual Queue Statistic — The statistic section is defined with the | + | * Virtual Queue Statistic — The statistic section is defined with the '''object-type''' option as '''VirtualQueue'''. |
| − | * Queue Group Statistic — The statistic section is defined with the | + | * Queue Group Statistic — The statistic section is defined with the '''object-type''' option as '''QueueGroup'''. |
| − | * Agent Group Statistic — The statistic section is defined with the | + | * Agent Group Statistic — The statistic section is defined with the '''object-type''' option as '''AgentGroup'''. |
| − | |||
| − | |||
Workspace tests if the configured objects exist in the configuration layer. If a statistic is defined for an object that does not exist, the configured statistic is not displayed. | Workspace tests if the configured objects exist in the configuration layer. If a statistic is defined for an object that does not exist, the configured statistic is not displayed. | ||
| − | You can also create sections that collect a group of related statistics to make it easier to specify which statistics can be displayed. For example, you might want to display two statistics (<tt>CC-Total_Answered and CC-Total_Abandoned statistics</tt>) for an agent group object and one (<tt> | + | You can also create sections that collect a group of related statistics to make it easier to specify which statistics can be displayed. For example, you might want to display two statistics (<tt>CC-Total_Answered and CC-Total_Abandoned statistics</tt>) for an agent group object and one (<tt>Stat-Agent-InboundCalls</tt>) for the current agent. |
| − | |||
| − | |||
To display <tt>CC-Total_Answered</tt> and <tt>CC-Total_Abandoned statistics</tt> for the agent group to which the agent belongs create a new section and add these two statistics as values: | To display <tt>CC-Total_Answered</tt> and <tt>CC-Total_Abandoned statistics</tt> for the agent group to which the agent belongs create a new section and add these two statistics as values: | ||
| + | <source lang="text"> | ||
[AG_Stats] | [AG_Stats] | ||
object-ids=AG1, AG2 | object-ids=AG1, AG2 | ||
object-type=AgentGroup | object-type=AgentGroup | ||
statistic-definitions=CC-Total_Answered,CC-Total_Abandoned | statistic-definitions=CC-Total_Answered,CC-Total_Abandoned | ||
| + | </source> | ||
| + | The following two figures show how this is configured in Genesys Administrator Extension: | ||
| − | Next, assign the value <tt>AG_Stats,KPI-InboundCalls</tt> to the '''statistics.gadget-statistics''' option. The three statistics are then available in the Workspace Main Menu bar. | + | [[File:GAPI_900_Agent_Group_Statistics.png|center|500px]] |
| + | |||
| + | [[File:GAPI_900_Agent_KPI.png|center|500px]] | ||
| + | |||
| + | Next, assign the value <tt>AG_Stats,KPI-InboundCalls</tt> to the '''statistics.gadget-statistics''' option. | ||
| + | |||
| + | The three statistics are then available in the Workspace Main Menu bar. | ||
[[File:GAPI_900_Three_Stats_Statistics_Gadget.png|center]] | [[File:GAPI_900_Three_Stats_Statistics_Gadget.png|center]] | ||
| − | You can use the {{Optionslink|link=Options: | + | You can use the {{Optionslink|link=Options:Genesys_Web_Services:interaction-workspace:permissions-agent-group-exclude}} or {{Optionslink|link=Options:Genesys_Web_Services:interaction-workspace:permissions-agent-group-restrict}} options to further refine which statistics are displayed in the Statistics Gadget and the Contact Center Statistics tab. |
{{AnchorDiv|FocusDuration}} | {{AnchorDiv|FocusDuration}} | ||
| Line 1,495: | Line 1,526: | ||
Workspace is an ''omni-channel application'' which means that agents might be handling multiple interactions on different channels for the same contact, or for multiple contacts. For example, an agent might be talking on the phone with a contact, sending the contact text information by the Chat channel, while composing an email to the contact; or, an agent might be handling multiple chats for multiple contacts while handling email interactions or workitems. In both of these example scenarios, the agent spends a little bit of time focused on each individual interaction; however, from a reporting perspective, the duration of handling is the total time from when each interaction was initiated until it was marked Done. This gives a false representation of the amount of time that an agent was actually handling each individual interaction. | Workspace is an ''omni-channel application'' which means that agents might be handling multiple interactions on different channels for the same contact, or for multiple contacts. For example, an agent might be talking on the phone with a contact, sending the contact text information by the Chat channel, while composing an email to the contact; or, an agent might be handling multiple chats for multiple contacts while handling email interactions or workitems. In both of these example scenarios, the agent spends a little bit of time focused on each individual interaction; however, from a reporting perspective, the duration of handling is the total time from when each interaction was initiated until it was marked Done. This gives a false representation of the amount of time that an agent was actually handling each individual interaction. | ||
| − | When the value of the {{Optionslink|link=Options: | + | When the value of the {{Optionslink|link=Options:Genesys_Web_Services:interaction-workspace:reporting-case-report-case-in-focus-duration}} option is set to <tt>true</tt>, which specifies whether the time that an interaction has been in the focus of the agent during its handling is reported to T-Server or Interaction Server at the end of its processing by the agent. When it is enabled, this notification allows Genesys Interaction Concentrator and Genesys Infomart to calculate focus time metrics. Workspace reports to the Genesys back-end the time, in seconds, that an individual interaction had the focus, that is, the time that the agent actually spent working directly or indirectly on this interaction. The duration of each interaction is reported as the sum of the times that the interaction had the focus of the agent. The assignment of focus-time to an interaction is based on the following rules: |
# At any given time, only one Case can be considered as ''in focus''. | # At any given time, only one Case can be considered as ''in focus''. | ||
#:Therefore, the sum of the focus-times of the agent cannot exceed the total focus-time. | #:Therefore, the sum of the focus-times of the agent cannot exceed the total focus-time. | ||
| Line 1,503: | Line 1,534: | ||
# When there is no Active Voice Call, the Case that has the visual focus, corresponding to the selected view, is considered as ''in focus''. This can be a Case that contains a non-Active Voice Call (for example, <tt>Dialing</tt>, <tt>On Hold</tt>, or <tt>Released</tt>). | # When there is no Active Voice Call, the Case that has the visual focus, corresponding to the selected view, is considered as ''in focus''. This can be a Case that contains a non-Active Voice Call (for example, <tt>Dialing</tt>, <tt>On Hold</tt>, or <tt>Released</tt>). | ||
# If Workspace loses the application focus, the Case that had visual focus at the time Workspace lost the focus continues to be considered as ''in focus''. | # If Workspace loses the application focus, the Case that had visual focus at the time Workspace lost the focus continues to be considered as ''in focus''. | ||
| + | |||
[[Category:V:HTCC:9.0.0DRAFT]] | [[Category:V:HTCC:9.0.0DRAFT]] | ||
Latest revision as of 15:24, July 29, 2022
Enabling agents to view KPIs and Contact Center Statistics
Agent Workspace includes two optional views and the Statistics Gadget that you can configure to display real-time agent Key Performance Indicators (KPIs) (Performance Tracker) and contact center statistics (Dashboard). KPIs enable agents to focus on their efficiency against the expectations of the contact center. Contact center statistics enable agents to see the overall performance of their contact center in a dashboard.
Workspace does not come with default KPIs and Statistics set up for you to display to your agents. However, a wide range of statistic definitions are supported that you can call on through configuration to display in the Performance Tracker and the Dashboard.
In the initial release of Workspace, the statistics definitions are provided in the Statistics_Definitions.cfg file, located in the root directory of the gws-microservices.tgz archive included in the IP.
Here is an example definition:
[statistics.definitions.CurrentReadyAgents_EXT_GA]
name=CurrentReadyAgents_EXT
location=/
notificationFrequency=60
insensitivity=1
category=CurrentNumber
subject=AgentStatus
mainMask=WaitForNextCall
notificationMode=Periodical
maskType=DN
objectTypes=GroupAgents
The name in square brackets is the definition name. The name following "name=" is the statistic name. The type following "objectTypes=" informs you of the scope of the statistics, such as Agent, GroupAgents, RoutingPoint, and so on.
The following definitions are supported:
[+] Statistics_Definitions.cfg
To enable KPIs and statistics, you create sections in the Workspace Application object that correspond to the statistic names provided in the Statistics_Defintions.cfg file, then, you configure the KPI and Contact Center Statistics options to display the statistics to your agents. The following sections provide examples of how to create sections and configure statistics for display.
KPIs
To display statistics (KPIs) in the Performance Tracker view of the Workspace interface, you must specify at least one statistic in the kpi.displayed-kpis option and grant the privilege.performance-tracker.can-use privilege.
The following is an example of how to create, modify, and specify the InternalCalls statistic for display.
The Statistics_Definitions.cfg file contains the following definition for tracking Internal Calls:
[statistics.definitions.InternalCalls_A]
name=InternalCalls
location=/
notificationFrequency=10
insensitivity=1
category=TotalNumber
subject=DNAction
intervalType=GrowingWindow
mainMask=CallInternal
dynamicTimeProfile=0:00
dynamicFilter=MediaType=voice
notificationMode=Periodical
maskType=DN
objectTypes=Agent- Choose a statistic that you want to display. For this example we will use InternalCalls.
- Create a section in the GWS Application Server object application object by using Genesys Administrator Extension, such as Stat-Agent-InternalCalls, for the Key specify the statistic-name option and assign InternalCalls as the value:
- (Recommended) Create an option in the section called Stat-Agent-InternalCalls and assign display-name as the key and Internal Calls as the value:
- (Optional) The statistics attributes (options) that you can specify for a statistics section include:
- statistic-name (mandatory)
- display-name (recommended)
- target-value
- warning-level-low
- warning-level-high
- error-level-low
- error-level-high
- worst-value-low
- worst-value-high
- statistic-type — possible values are: duration and number. If statistic-type isn't specified, the default type is number except if the statistics name includes the keyword duration.
- measurement-unit — an optional display value.
Refer to Setting the Warning, Error, and Worst Levels for more information about how to use the target, warning, error, and worst attributes.
- Repeat steps 1 through 5 for each statistic that you want to use.
- To make the statistic display in the Performance Tracker, specify the section name in the kpi.displayed-kpis option in the interaction-workspace section of the GWS Application Server object application object. You can also specify this option at the agent, agent group, or skill level.
Specify the statistics in the order in which you want the statistics to be displayed in the Workspace interface. For example: Stat-Agent-InternalCalls,Stat-Agent-InboundCalls,Stat-Agent-OutboundCalls,Stat-Agent-ConsultCalls,Stat-Agent-HoldDuration,Stat-Agent-AverageHandlingTime,Stat-Agent-ReadyDuration,Stat-Agent-TalkDuration


Contact Center Statistics
To display contact center statistics in the Dashboard tab of the Agent Workspace interface, you must specify at least one statistic in the statistics.displayed-statistics option and grant the privilege.monitor-dashboard.can-use privilege.
The following is an example of how to specify the AverageWaitingTime statistic for display.
The Statistics_Definitions.cfg file contains the following definition for tracking Average waiting time:
[statistics.definitions.v2v3_AverageWaitingTime_RP]
name=AverageWaitingTime
location=/
notificationFrequency=60
insensitivity=1
intervalLength=0
distinguishByConnId=false
category=AverageTime
subject=DNAction
intervalType=GrowingWindow
maskType=ROUTE_POINT
mainMask=CallWait
relativeMask=CallWait
dynamicTimeProfile=7:00
dynamicFilter=MediaType=voice
timeRange1=0:0
timeRange2=0:0
notificationMode=Periodical
objectTypes=RoutePoint- Choose a statistic that you want to display. In this example we will use AverageWaitingTime.
- Create a section in the GWS Application Server object application object by using Genesys Administrator Extension, such as Stat-CC-AverageWaitingTime, for the Key specify the statistic-name option and assign
- Assign AverageWaitingTime as the value.
- (Recommended) Create an option in the section called Stat-CC-AverageWaitingTime and assign display-name as the key and Average Customer Wait Time as the value:
- (Optional) The statistics attributes (options) that you can specify for a statistics section include::
- statistic-name (mandatory)
- display-name (recommended)
- target-value
- warning-level-low
- warning-level-high
- error-level-low
- error-level-high
- worst-value-low
- worst-value-high
- statistic-type — possible values are: duration, number. If statistic-type isn't specified, the default type is number excepted if the statistics name includes the duration keyword.
- measurement-unit — an optional display value.
- Repeat steps 1 through 5 for each statistic that you want to use.
- In the interaction-workspace section in the GWS Application Server object application, specify the name of the section that you created in Step 2 as one of the values of the statistics.displayed-statistics option. The value of this option is a coma-separated list of section names defined in the GWS Application Server object application. Specify the statistics in the order in which you want the statistics to be displayed in the Workspace interface. For example: Stat-CC-AverageWaitingTime,Stat-CC-Current_In_Queue,Stat-CC-CurrMaxCallWaitingTime,Stat-CC-ServiceLevel,Stat-CC-Total_Abandoned,Stat-CC-Total_Answered
- Specify the queue group, agent group, routing point, and/or virtual queue for which you want statistics reported by using the following options:
- Use the permissions.agent-group.exclude option to specify the list of agent groups or virtual agent groups to be excluded from Statistics, or use the permissions.agent-group.restrict option to specify the list of agent groups or virtual agent groups to which Statistics are restricted.
- Specify the refresh time, in seconds, for the statistics in the Contact Center Statistics tab by using the statistics.refresh-time option.


Setting the Warning, Error, and Worst Levels
Workspace provides eight non-mandatory options that you can use to define low and/or high levels of warning and error and low and/or high levels of worst values.
Some statistics are in an error state when they are below a certain value, while others are in an error state when they are above a certain value; for some statistics both a lower error threshold and a higher error threshold are required. The following non-mandatory options enable you to set a low and high threshold for a statistic:
- error-level-low: Values below this value are in an error state for the statistic.
- error-level-high: Values above this value are in an error state for the statistic.
Some statistics are in a warning state when they are below a certain value, while others are in a warning state when they are above a certain value; for some statistics both a lower warning threshold and a higher warning threshold are required. The following non-mandatory options enable you to set a low and high threshold for a statistic:
- warning-level-low: Values below this value are in a warning state for the statistic.
- warning-level-high: Values above this value are in a warning state for the statistic.
Use the error and warning options to specify ranges that are most suitable for the statistic.
Some statistics are performance based. The agent's result is compared to a target value to determine the agent's level of performance. Some statistics require a lower worst value and some require a higher worst value. For some statistics, both a lower and a higher worst value are required.
- worst-value-low: Values below this value result in a negative evaluation for the KPI.
- worst-value-high: Values above this value result in a negative evaluation for the KPI.
- target-value: The target value to be reached by the agent.
These options control when the following icons are displayed in the Dashboard (Contact Center Statistics) region and Performance Tracker (KPI) view:
- A worst icon (
 ) is displayed if the evaluation of the performance is below the expected worst low level or above the worst high level for the agent statistic (KPI) or contact center statistic.
 - An error icon (
 ) is displayed if the evaluation of the performance is below the expected error low level or above the error high level for the agent statistic (KPI) or contact center statistic.
 - A warning icon (
 ) is displayed if the evaluation of your performance for the agent statistic (KPI) or contact center statistic is below the expected warning low level or above the warning high level.
In the Performance Tracker view they also configure the appearance of the statistic indicator bars, for example:

Statistics Gadget
The Workspace Statistics Gadget enables your agents to constantly monitor key statistics that you specify. You can specify one or more statistics to be displayed to the agent at all times in the Main Menu bar of the Workspace window.
The Contact Center Statistics tab and Performance Tracker enable agents to view all the statistics and KPIs that you define; however, to view these, the agent must open those tabs, which temporarily hides the rest of the Workspace window.
Refer to the Workspace Help for information about using the Statistic Gadget.
Use the statistics.gadget-statistics option to specify a section or sections that contain a statistic or statistics to be displayed in the Statistics Gadget. If more than one statistic is specified, the first one is displayed by default. The others can be displayed by hovering the mouse pointer over the gadget or by clicking the gadget to open a menu that enables selection of a different statistic.
Use the statistics.gadget-statistics.max-size option to specify the maximum number of statistics that can be displayed in the Statistics Gadget. If you specify a number of statistics in the statistics.gadget-statistics option that exceeds this number, only the first n statistics are displayed.
Configuring the statistics.gadget-statistics option
The statistics.gadget-statistics option enables you to specify statistic sections to be displayed. The section should contain the name of the statistics definition, specified by the statistic-definitions option and the list of objects for which the statistic should be displayed (in the object-ids option) and the type of the object (in the object-type option). The list of objects in object-ids should all be from the same type (for example, Agent Groups), and this type of object should be specified in the object-type option.
You can also specify the following options in the statistic section to add the name and the type of the statistic:
- object-ids: The ids of Agent Groups, Virtual Queues, DN Groups, and Routing Points
- object-type: Statistics can be displayed for four different types of objects:
- Agent Group — Statistics for an agent group or virtual agent group
- Routing Point — Statistics for a Routing Point
- Virtual Queue — Statistics for a Virtual Queue
- Queue Group — Statistics for a Group of DNs
Valid values for this option are the names of sections that you have defined that contain the definitions of statistics, such as the name of the statistic, the name of the object for which the statistic is calculated, object type, object id, and so on.
- Agent Statistic — If the statistic section is defined only with a statistic-name option, the statistic is considered as a statistic for the currently logged-in agent.
- Routing Point Statistic — The statistic section is defined with the object-type option as RoutingPoint.
- Virtual Queue Statistic — The statistic section is defined with the object-type option as VirtualQueue.
- Queue Group Statistic — The statistic section is defined with the object-type option as QueueGroup.
- Agent Group Statistic — The statistic section is defined with the object-type option as AgentGroup.
Workspace tests if the configured objects exist in the configuration layer. If a statistic is defined for an object that does not exist, the configured statistic is not displayed.
You can also create sections that collect a group of related statistics to make it easier to specify which statistics can be displayed. For example, you might want to display two statistics (CC-Total_Answered and CC-Total_Abandoned statistics) for an agent group object and one (Stat-Agent-InboundCalls) for the current agent.
To display CC-Total_Answered and CC-Total_Abandoned statistics for the agent group to which the agent belongs create a new section and add these two statistics as values:
 [AG_Stats]
 object-ids=AG1, AG2
 object-type=AgentGroup
 statistic-definitions=CC-Total_Answered,CC-Total_Abandoned
The following two figures show how this is configured in Genesys Administrator Extension:


Next, assign the value AG_Stats,KPI-InboundCalls to the statistics.gadget-statistics option.
The three statistics are then available in the Workspace Main Menu bar.

You can use the permissions.agent-group.exclude or permissions.agent-group.restrict options to further refine which statistics are displayed in the Statistics Gadget and the Contact Center Statistics tab.
Focus duration
Workspace is an omni-channel application which means that agents might be handling multiple interactions on different channels for the same contact, or for multiple contacts. For example, an agent might be talking on the phone with a contact, sending the contact text information by the Chat channel, while composing an email to the contact; or, an agent might be handling multiple chats for multiple contacts while handling email interactions or workitems. In both of these example scenarios, the agent spends a little bit of time focused on each individual interaction; however, from a reporting perspective, the duration of handling is the total time from when each interaction was initiated until it was marked Done. This gives a false representation of the amount of time that an agent was actually handling each individual interaction.
When the value of the reporting.case.report-case-in-focus-duration option is set to true, which specifies whether the time that an interaction has been in the focus of the agent during its handling is reported to T-Server or Interaction Server at the end of its processing by the agent. When it is enabled, this notification allows Genesys Interaction Concentrator and Genesys Infomart to calculate focus time metrics. Workspace reports to the Genesys back-end the time, in seconds, that an individual interaction had the focus, that is, the time that the agent actually spent working directly or indirectly on this interaction. The duration of each interaction is reported as the sum of the times that the interaction had the focus of the agent. The assignment of focus-time to an interaction is based on the following rules:
- At any given time, only one Case can be considered as in focus.
- Therefore, the sum of the focus-times of the agent cannot exceed the total focus-time.
- When a Case is considered to be in focus, the time in focus is assigned to the Main interaction of the case; that is, the interaction that initiated the case (for example an inbound chat or an outbound call).
- The Case that contains the current Active Voice Call (Established) is considered as in focus, whether the voice call in the Case is the main interaction, a secondary interaction, or a consultation.
- There cannot be more that one Active Voice Call at a given time.
- When there is no Active Voice Call, the Case that has the visual focus, corresponding to the selected view, is considered as in focus. This can be a Case that contains a non-Active Voice Call (for example, Dialing, On Hold, or Released).
- If Workspace loses the application focus, the Case that had visual focus at the time Workspace lost the focus continues to be considered as in focus.