(Update with the copy of version: Public) |
(Automated save: adding PEC_Migrated template.) |
||
| Line 1: | Line 1: | ||
= Developer Console = | = Developer Console = | ||
| + | |||
| + | {{Template:PEC_Migrated}} | ||
| + | |||
| + | |||
Developer Console is a web-based tool for developers to help debug applications built against the [[APIs|PureEngage Cloud APIs]]. You can use the console to view all logs associated with your API key and filter based on parameters such as service (API), time period, and type. | Developer Console is a web-based tool for developers to help debug applications built against the [[APIs|PureEngage Cloud APIs]]. You can use the console to view all logs associated with your API key and filter based on parameters such as service (API), time period, and type. | ||
Revision as of 22:45, June 21, 2020
Contents
Developer Console
Developer Console is a web-based tool for developers to help debug applications built against the PureEngage Cloud APIs. You can use the console to view all logs associated with your API key and filter based on parameters such as service (API), time period, and type.
Accessing the Developer Console
To access Developer Console, contact your Genesys representative.
Web browser requirements
You access the Developer Console interface through the following supported web browser:
- Chrome 68 or later
Using the Developer Console
When you first access the console, you'll see all logs for the first item in the API Key dropdown list. To get started, all you need to do is choose your filters and specify some text to search — the results list updates dynamically as you interact with the UI.
Filtering logs
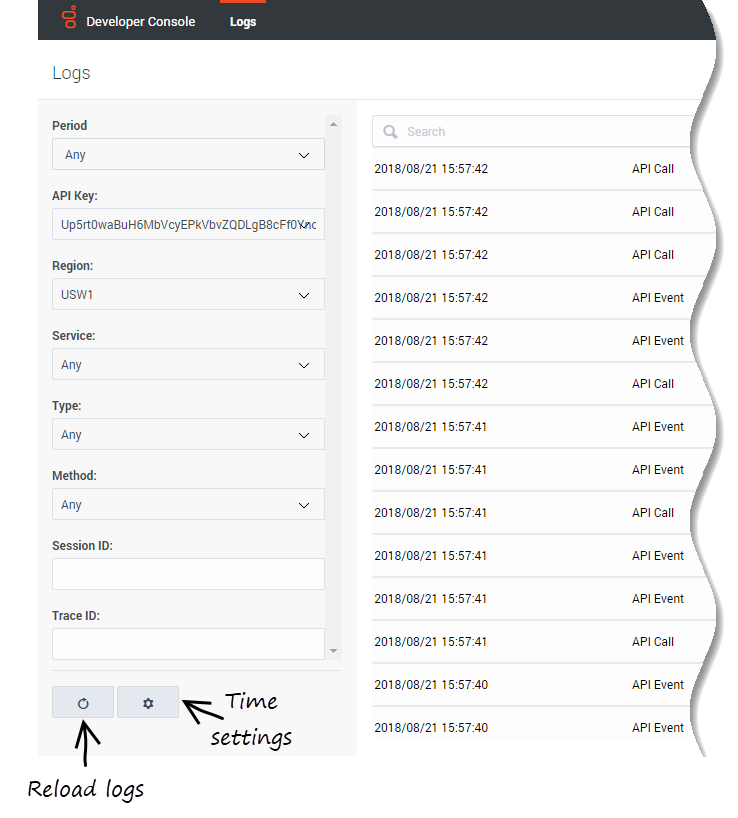
The Developer Console offers the following filters:
- Period — You can choose one of the preconfigured time periods or create your own by selecting "Custom". Choose "Jump to time" to specify a time range on a particular date. For example, you could set a start time of 2:55:00 PM on 8/20/2018 and choose a range of 30 minutes. This filters the results to only show logs from 2:55 to 3:25 on 8/20/2018.
- API Key — The unique API keys associated with your applications or tenants. By default, the console shows logs for the first API key in the list.
- Region — The geographical region where your contact center is provisioned.
- Service — The service (API). Possible values are Authentication, Provisioning, Workspace, and Statistics.
- Type — Log entries based on the type of activity they represent. The values are API Call and API Event (the CometD event that was returned asynchronously in response to a request).
- Method — The HTTP Method used to make an API call.
- Session ID — Shows only logs for the session ID you enter.
- Trace ID — Shows only logs for the trace ID you enter.
You can use the corresponding button at the bottom of the filters to reload the logs. There's also a button you can select to access the time settings. Here you can configure the timezone and set whether logs are displayed in ascending or descending order based on the timestamp.
Searching logs
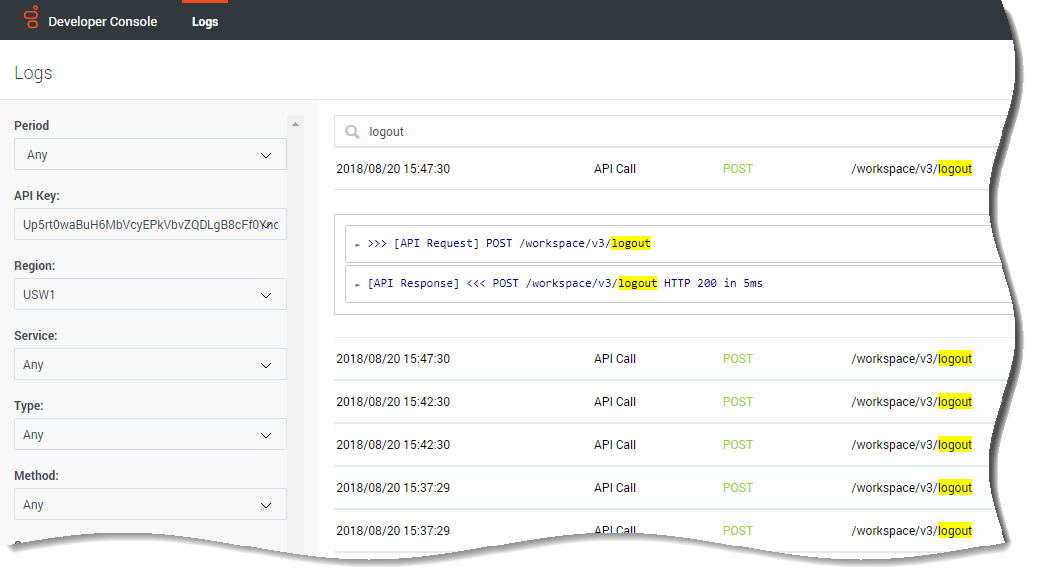
You can rely on the filters to return relevant logs, or you can also narrow down the results by searching for a specific term. This term can be anything that might show up in the log file — an agent ID, the name of a request, and so on. As you type, the search results update dynamically and the term you're searching for is highlighted in yellow. You'll also see this highlighting in the details of the result when you drill down.
Understanding the results
All log search results are grouped by trace ID — you can see the ID in log messages as X-B3-TraceId. The trace ID is unique and associated with a particular API request and any related requests it might make to underlying Genesys services. If you know the trace ID, you can search for it directly rather than filtering by time range, for example.
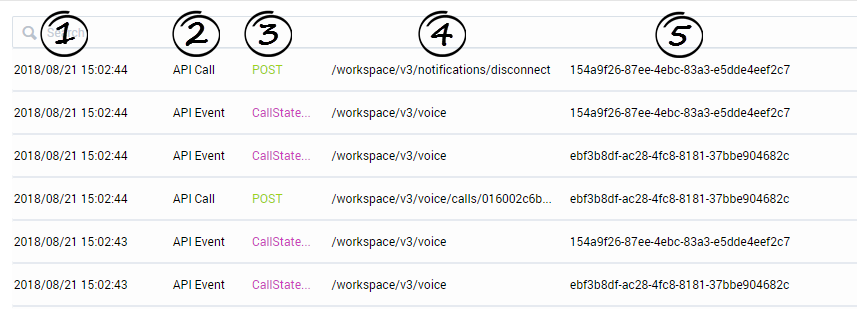
Each line in the search results represents either an API call or event and usually displays the following fields:
- Timestamp — The date/time when the activity occurred.
- Type — The type of activity: API Call or API Event.
- Method / message type — For API calls, this field is the HTTP method (POST, GET, and so on). For API events, this field is the CometD message type.
- Request URL / channel name — For API calls, this field is the request URL. For API events, this field is the name of the CometD channel.
- Session ID — The unique ID for the user's session.
To see the log details, click a search result item.
For API call logs, you'll see a list of requests and responses for the trace ID. These are easy to identify with their >>> [API Request] and [API Response] <<< prefixes. For requests, the prefix is followed by the HTTP method and path. For responses, the HTTP response code and execution time are included. You might see additional information, depending on the API.
You can click the request or response to expand the section and see the details included in the log message. Whenever you see ![]() in a log message, click to view more information.
in a log message, click to view more information.


