(→Viewing the list of configured queues) |
(→Viewing the list of configured queues) |
||
| Line 26: | Line 26: | ||
{{CloudStep_Stack | {{CloudStep_Stack | ||
|title= | |title= | ||
| − | |text=The '''Tools''' > '''Queues''' menu option opens a page that shows you the list of configured queues. The page includes information for each queue such as Estimated Wait Time and the number of callbacks in queue. If <tt>Unknown</tt> values are displayed for a queue, it means that the queue cannot return data for some reason; for example, the queue might be inactive. | + | |text=The '''Tools''' > '''Queues''' menu option opens a page that shows you the list of configured queues. The page includes information for each queue such as Estimated Wait Time and the number of callbacks in queue. Queues are displayed in pages of 50 items. If <tt>Unknown</tt> values are displayed for a queue, it means that the queue cannot return data for some reason; for example, the queue might be inactive. |
The '''Callback Queues''' page pulls data when you first open the page, but does not continually check for new data. To update the data for a specific queue, click '''Refresh''' for that queue. When you click '''Refresh''' at the top of the page, it refreshes the data for every queue. | The '''Callback Queues''' page pulls data when you first open the page, but does not continually check for new data. To update the data for a specific queue, click '''Refresh''' for that queue. When you click '''Refresh''' at the top of the page, it refreshes the data for every queue. | ||
| Line 44: | Line 44: | ||
|text=On the '''Callback Queues''' page, it is sometimes helpful to reduce the list to only one queue or a few queues for which you want to find information. | |text=On the '''Callback Queues''' page, it is sometimes helpful to reduce the list to only one queue or a few queues for which you want to find information. | ||
| − | To filter the list, | + | To filter the list, enter a queue name in the field at the top of the page and click '''Filter'''. |
|media1=CallbackUI_tools-tab_queues-page-filtering.png | |media1=CallbackUI_tools-tab_queues-page-filtering.png | ||
}} | }} | ||
| Line 50: | Line 50: | ||
{{CloudStep_Stack | {{CloudStep_Stack | ||
|title= | |title= | ||
| − | |text=In addition to filtering, you can also click | + | |text=In addition to filtering, you can also click the '''Queue''' column heading to sort data based on that column. |
|media1=CallbackUI_tools-tab_queues-page_column-sorting.png | |media1=CallbackUI_tools-tab_queues-page_column-sorting.png | ||
}} | }} | ||
Revision as of 14:34, September 9, 2019
Contents
Using Callback Tools
The Callback application includes a Tools tab, which offers additional views and tools to assist with callback management, configuration, and troubleshooting. You must be a member of the Administrator, Supervisor, or Developer Role to access the Tools tab.
The Tools tab includes the following menu options:
- You can look up when your tenant's configuration data was last refreshed. You can also force a data refresh.
- You can view the complete list of configured queues. The list includes detailed information about each queue.
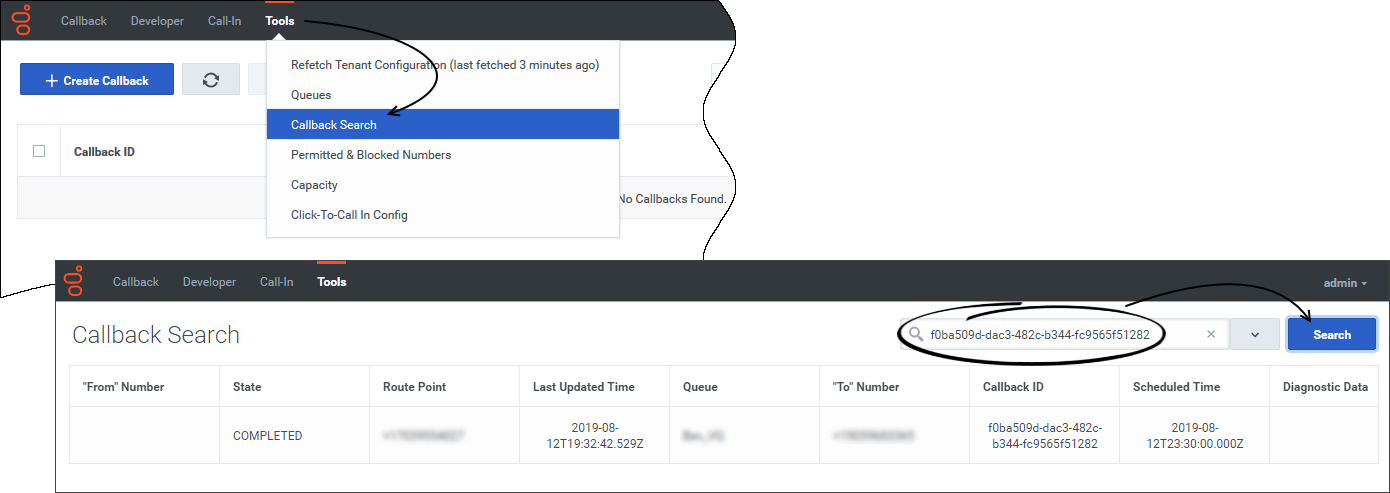
- You can search for a specific interaction within the callback records.
- You can configure rules that will be assigned to queues. For example, you might want to limit the countries to which you allow callbacks or limit the number of scheduled callbacks that you allow within a certain time interval.
This page gives you an overview of the Tools tab menu options. Some of the work that you can perform on pages that are accessible from the Tools tab requires more explanation than an overview can provide. In those cases, links to pages that contain detailed information are included in the descriptions.
Refreshing your Tenant Configuration data
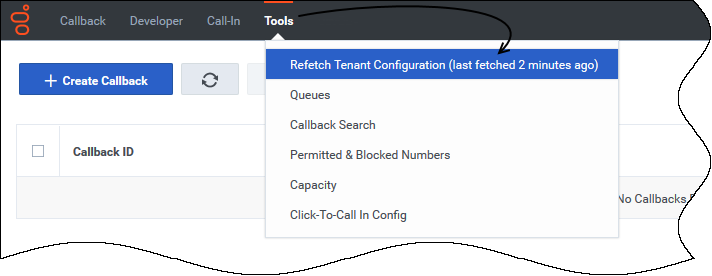
By default, the system refreshes the Tenant configuration every 30 minutes. The Tools > Refetch Tenant Configuration menu option shows you how long it has been since the data was last updated.
When you click Refetch Tenant Configuration, the system refreshes tenant configuration data throughout the Callback application. For example, you might want to force a refresh of data to immediately reflect configuration changes in features that are affected by such settings.
Viewing the list of configured queues
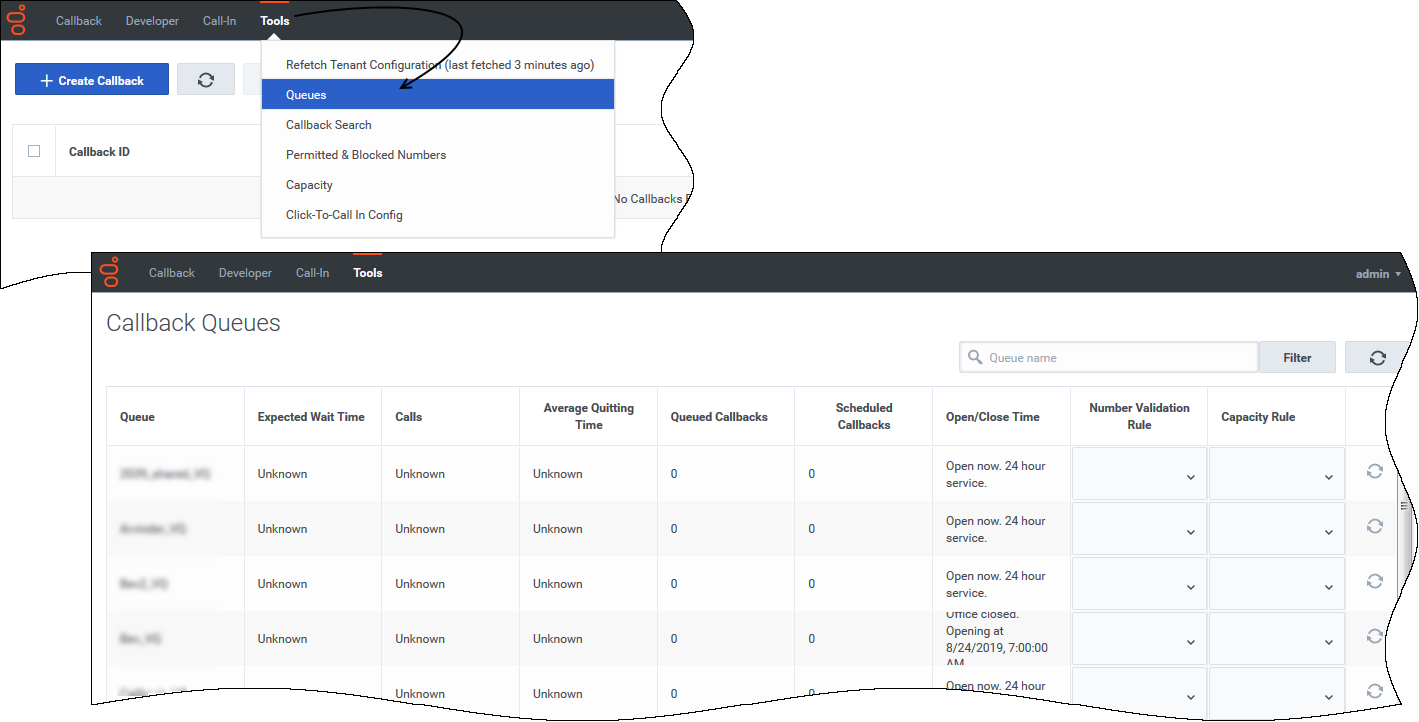
The Tools > Queues menu option opens a page that shows you the list of configured queues. The page includes information for each queue such as Estimated Wait Time and the number of callbacks in queue. Queues are displayed in pages of 50 items. If Unknown values are displayed for a queue, it means that the queue cannot return data for some reason; for example, the queue might be inactive.
The Callback Queues page pulls data when you first open the page, but does not continually check for new data. To update the data for a specific queue, click Refresh for that queue. When you click Refresh at the top of the page, it refreshes the data for every queue.
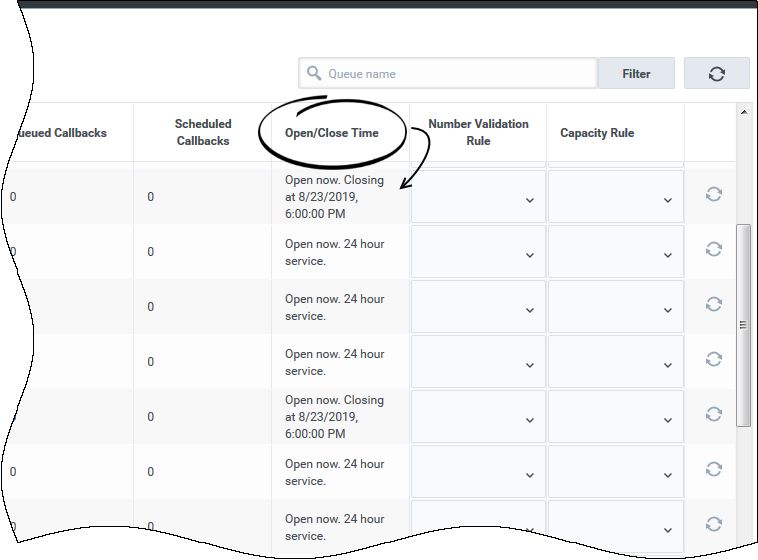
The Callback Queues page provides information about Open and Close times for each queue. The time displayed is based on the time zone configured for the device that you are using to access the Callback application.
On the Callback Queues page, it is sometimes helpful to reduce the list to only one queue or a few queues for which you want to find information.
To filter the list, enter a queue name in the field at the top of the page and click Filter.
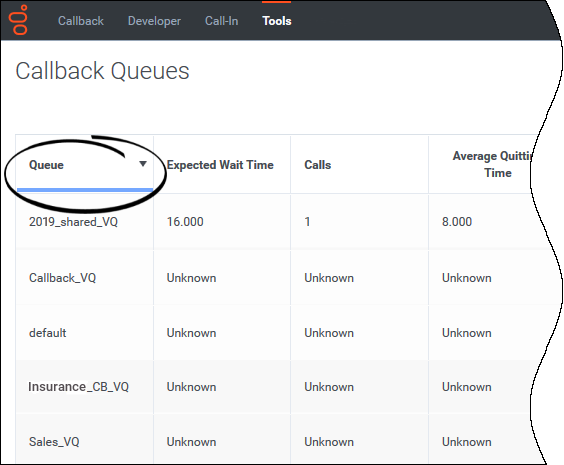
In addition to filtering, you can also click the Queue column heading to sort data based on that column.
Searching for a specific interaction
The Tools > Callback Search menu option lets you search for a specific callback interaction. To search for an interaction, enter either the callback ID or the customer's phone number.
Configuring rules for queues
The Tools tab includes menu options to configure the following types of rules, which you can then assign to queues:
- Patterns: Country and number validation rules. These rules specify the countries to which you allow callbacks and can include a list of "blacklist" numbers (blocked number patterns) within those countries.
- Capacity: Callback capacity rules. These rules specify the maximum number of scheduled callbacks that are allowed within each time slot for a week.

