(Created target blank page For Version: PSAAS:Public) |
(Update with the copy of version: draft) |
||
| Line 1: | Line 1: | ||
| − | + | =Monitor workitems = | |
| + | The '''Summary''' tab in iWD Manager gives you several options for displaying dashboards for monitoring the state of workitems controlled by iWD: | ||
| + | *[[IWDMonitor#Volume|By volume]] | ||
| + | *[[IWDMonitor#Backlog|By backlog]] | ||
| + | *[[IWDMonitor#SLA|By Service Level Agreement]] | ||
| + | *[[IWDMonitor#Categories|By categories]] | ||
| + | *[[IWDMonitor#Timing|By timing]] | ||
| + | *[[IWDMonitor#Path|By path]] | ||
| + | |||
| + | All the displays reflect the currently selected time frame, the selected Category and Query. | ||
| + | |||
| + | {{AnchorDiv|Volume}} | ||
| + | {{CloudStep_Stack | ||
| + | |title=By volume | ||
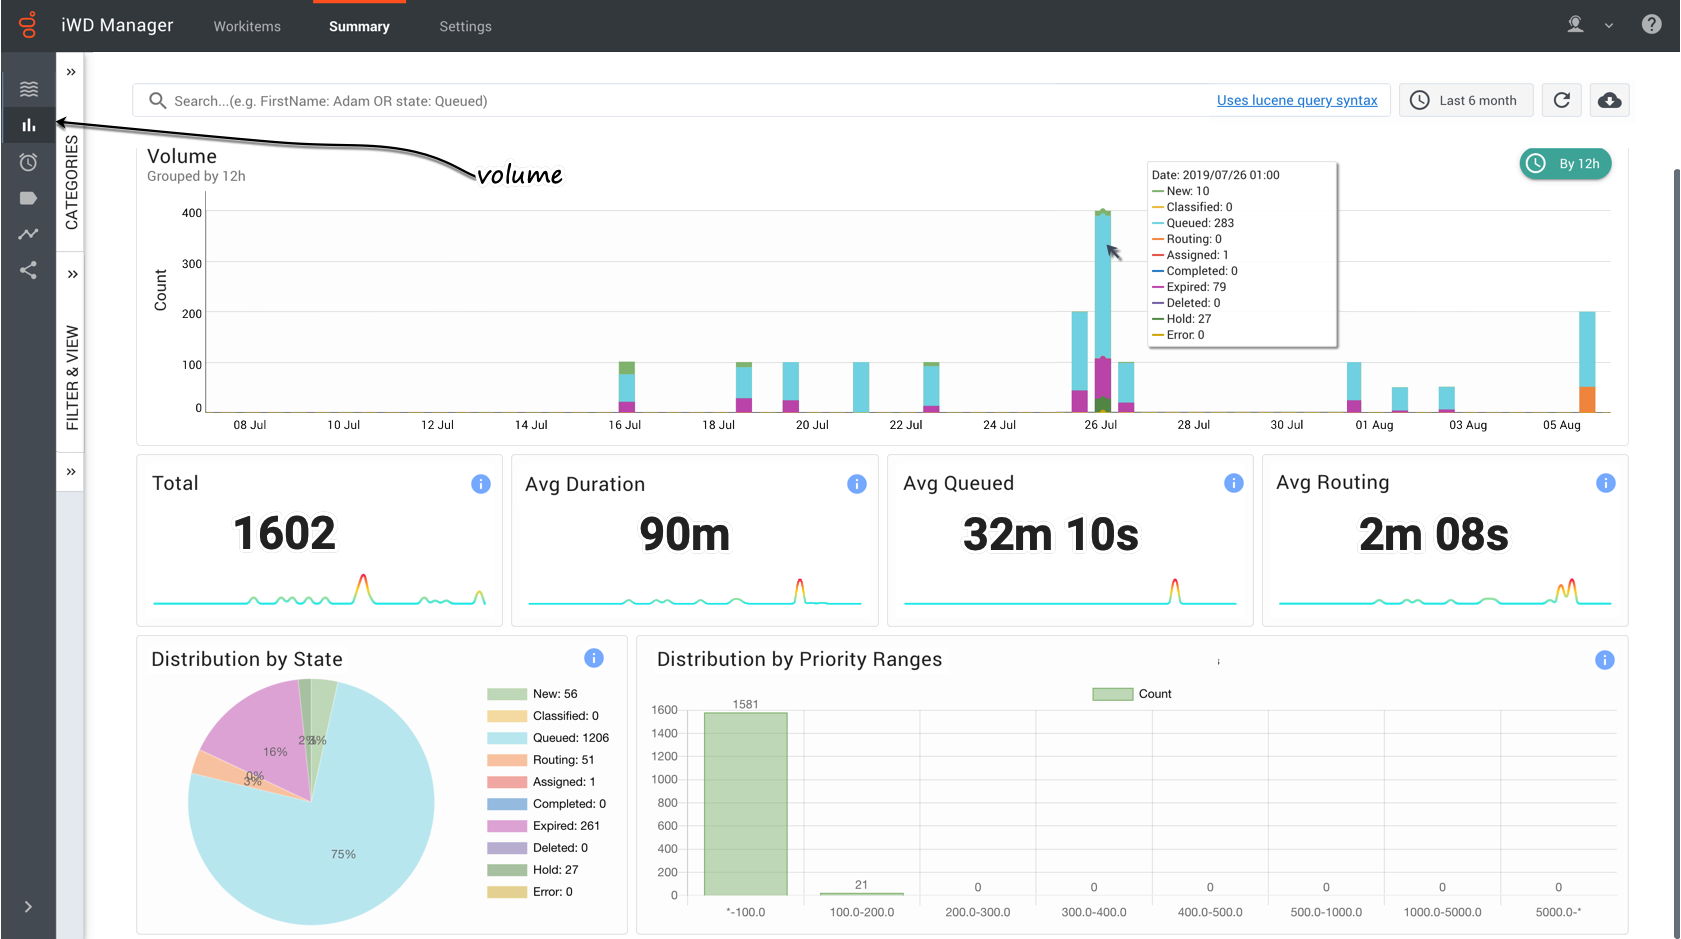
| + | |text=Displays dynamic histogram and summary totals (total, average duration, average time in queue, average time in routing) for the selected time interval and category, and distributions by state (pie chart) and priority ranges (bar chart). | ||
| + | You can: | ||
| + | *Dynamically change the time interval and category for display. | ||
| + | *Dynamically select a predefined query for display. | ||
| + | *Hover over points in any graph to display a detail panel for the selected data point. | ||
| + | *Use your cursor to drag a box to select a range of columns and drill down to a lower level of detail. | ||
| + | |media1=ManagerSummaryVolume.png | ||
| + | }} | ||
| + | |||
| + | {{AnchorDiv|Backlog}} | ||
| + | {{CloudStep_Stack | ||
| + | |title=By backlog | ||
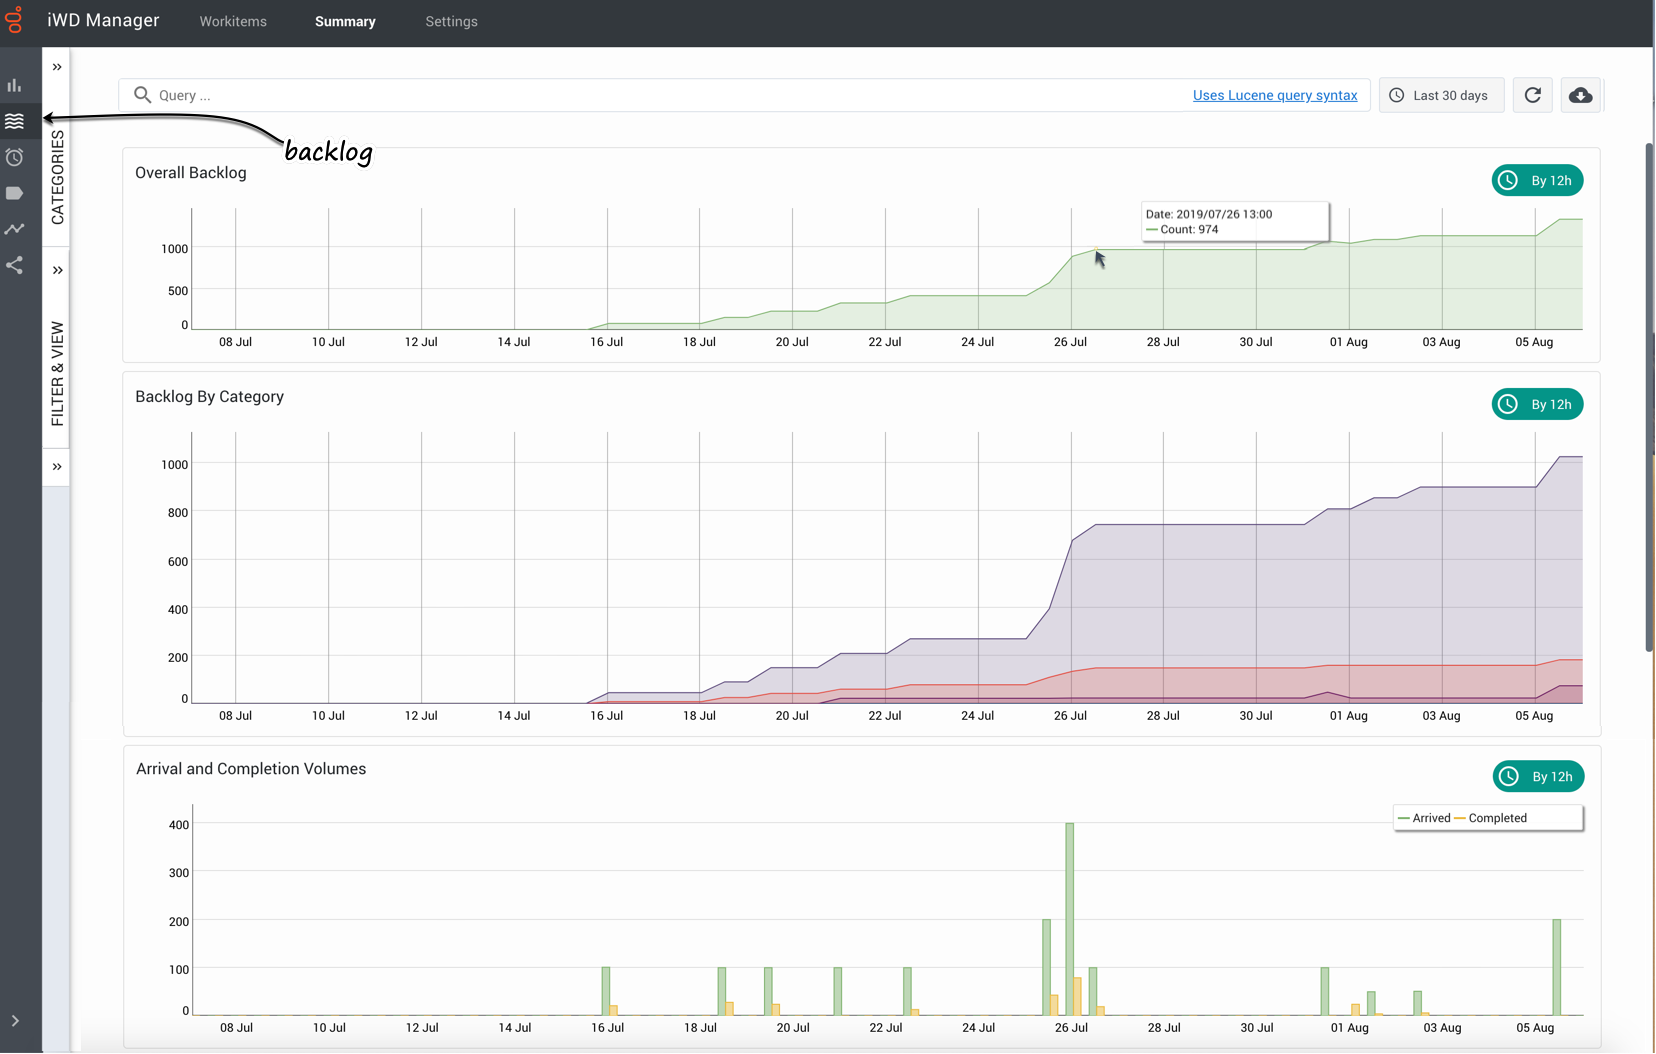
| + | |text=Displays dynamically the overall backlog, the backlog by category, and arrival and completion volumes. | ||
| + | You can: | ||
| + | *Dynamically change the time interval and category for display. | ||
| + | *Dynamically select a predefined query for display. | ||
| + | *Hover over populated areas of the graph to display a detail panel for the date and time selected. | ||
| + | *Use your cursor to drag a box to select a range of columns and drill down to a lower level of detail. | ||
| + | |media1=ManagerSummaryBacklog.png | ||
| + | }} | ||
| + | |||
| + | {{AnchorDiv|SLA}} | ||
| + | {{CloudStep_Stack | ||
| + | |title=By SLA | ||
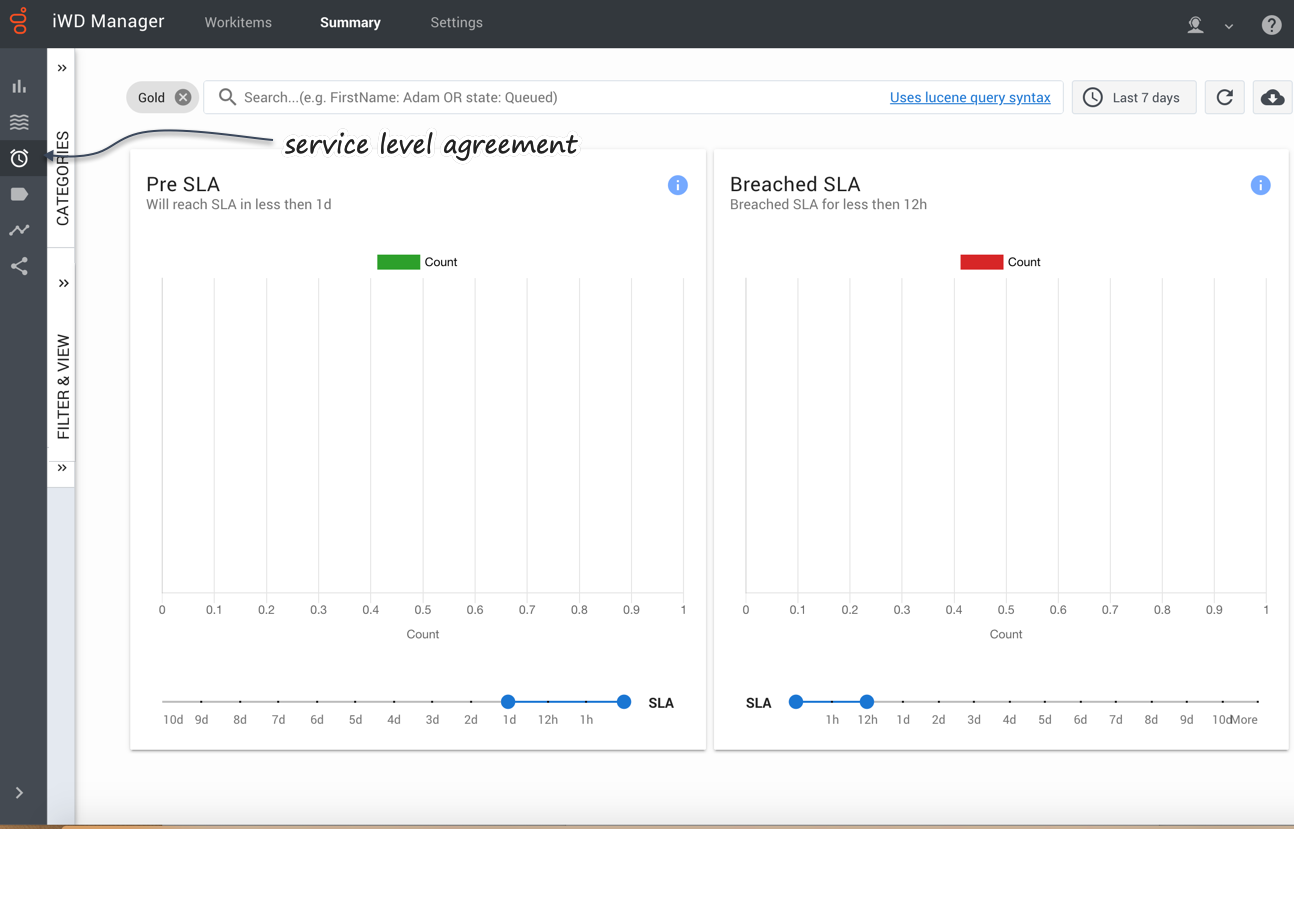
| + | |text=Displays dynamically workitem counts for selected pre-SLA intervals, and for workitems that have breached their SLA by selected intervals. | ||
| + | You can: | ||
| + | *Dynamically change the time interval and category for display. | ||
| + | *Dynamically select a predefined query for display. | ||
| + | *Hover over populated areas of the graph to display a detail panel for the date and time selected. | ||
| + | |media1=ManagerSummarySLA.png | ||
| + | }} | ||
| + | |||
| + | {{AnchorDiv|Categories}} | ||
| + | {{CloudStep_Stack | ||
| + | |title=By categories | ||
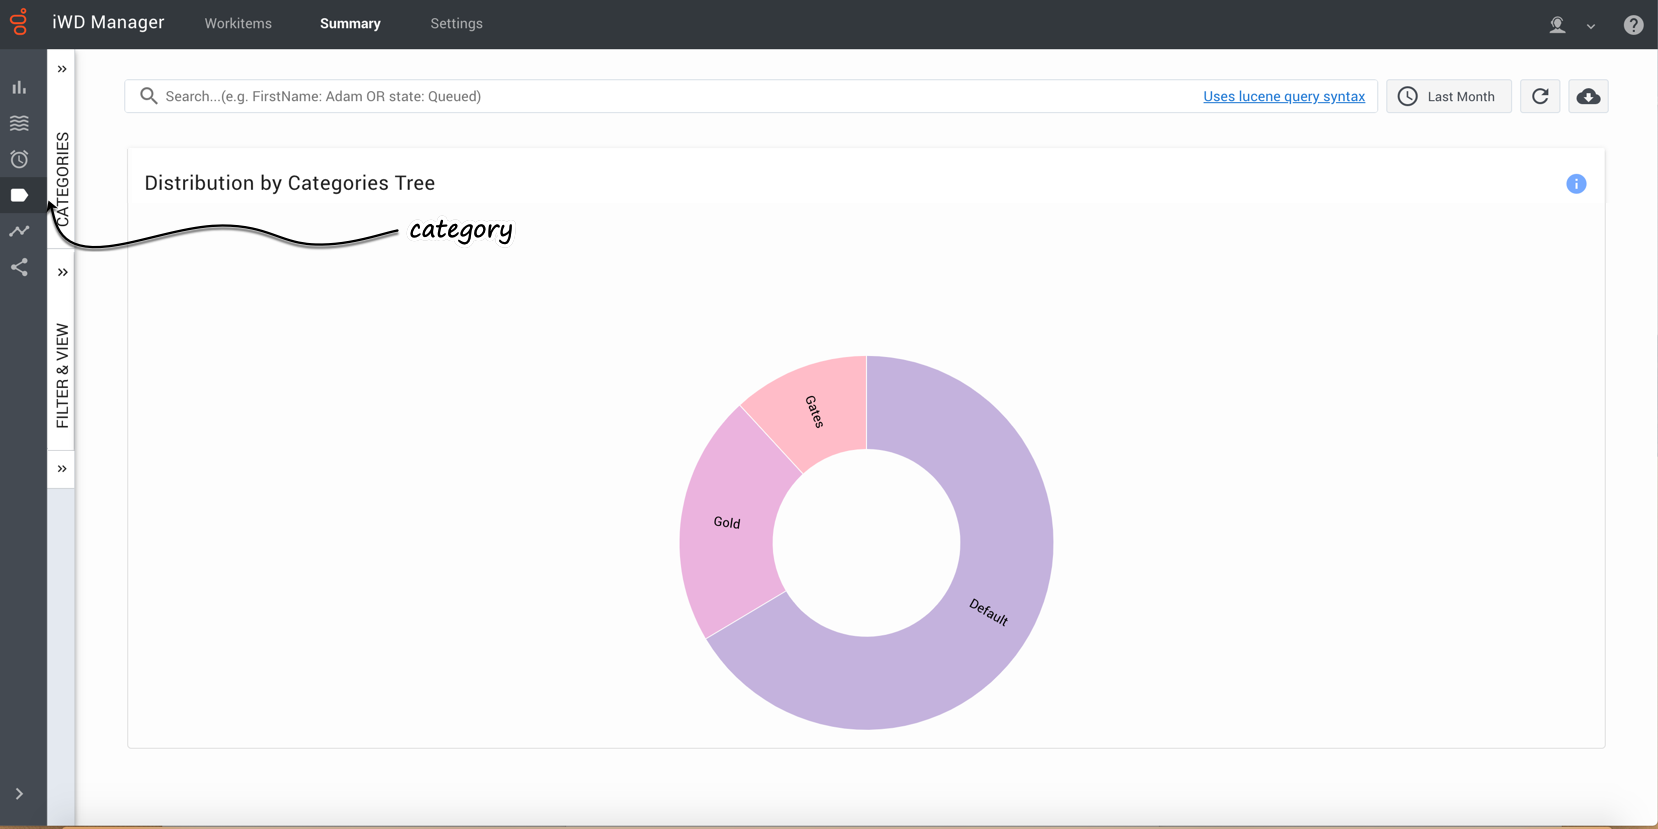
| + | |text=Displays dynamically the distribution of workitems across the available categories for the date and time selected. You can select current or historical time intervals for a rapid visual comparison. | ||
| + | |||
| + | You can also dynamically select a predefined query for display. | ||
| + | |||
| + | Hover over a Category chart to display information about that Category. | ||
| + | |media1=ManagerSummaryCategory.png | ||
| + | }} | ||
| + | |||
| + | {{AnchorDiv|Timing}} | ||
| + | {{CloudStep_Stack | ||
| + | |title=By timing | ||
| + | |text=Displays dynamically the volume of transactions, plus average duration times and average routing duration times. | ||
| + | You can: | ||
| + | *Dynamically change the time interval and category for display. | ||
| + | *Dynamically select a predefined query for display. | ||
| + | *Hover over populated areas of the graph to display a detail panel for the date and time selected. | ||
| + | |media1=ManagerSummaryTiming.png | ||
| + | }} | ||
| + | |||
| + | {{AnchorDiv|Path}} | ||
| + | {{CloudStep_Stack | ||
| + | |title=By path | ||
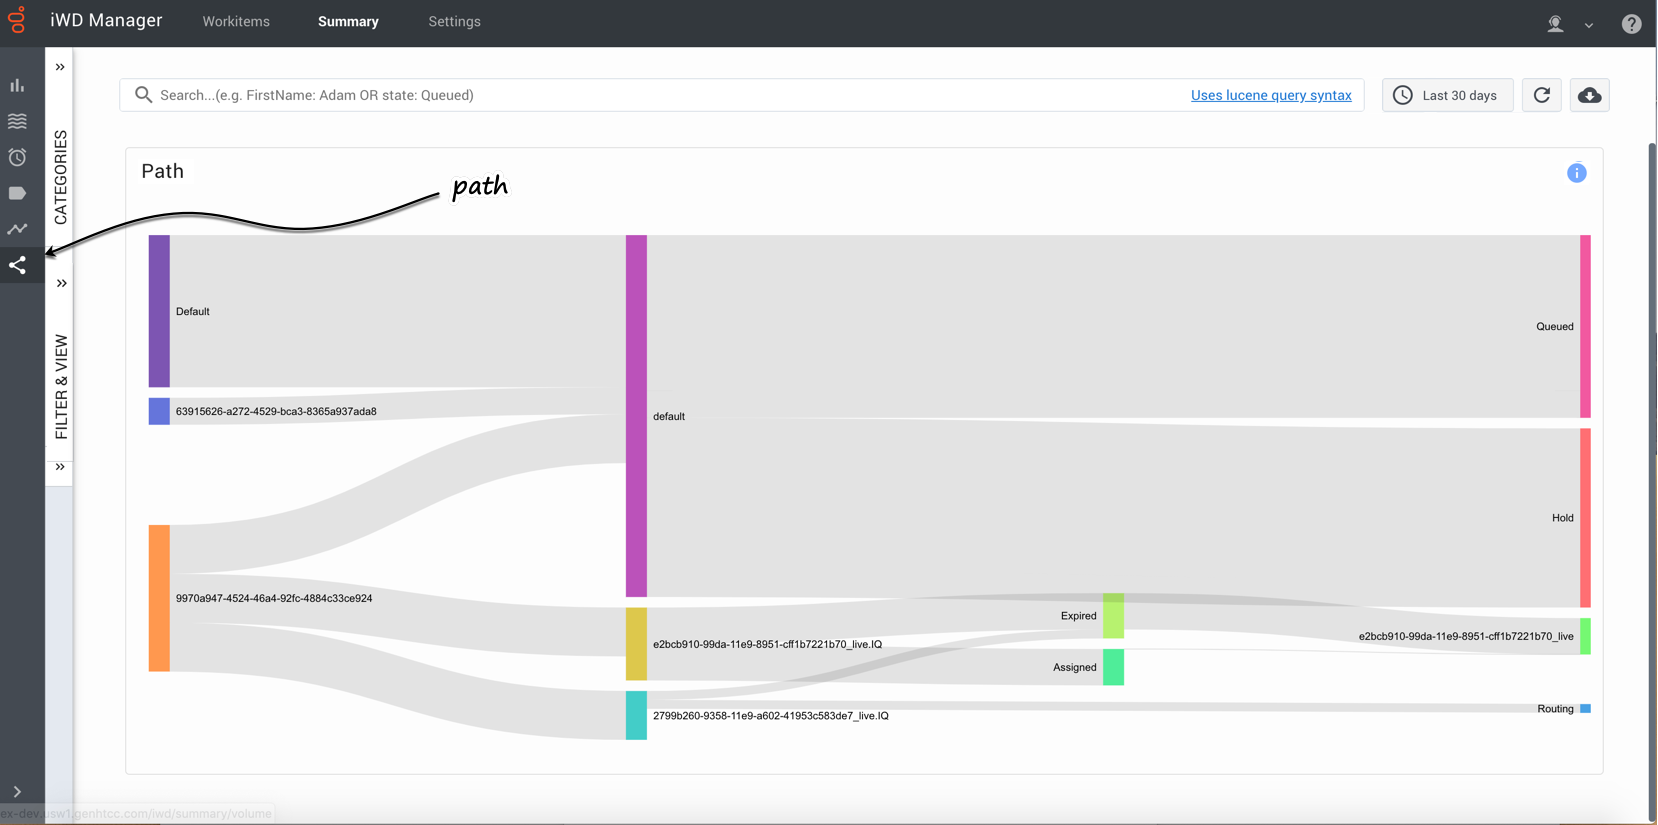
| + | |text=The Path dashboard enables users to see where the workitem has been segmented, queued in Designer and matched with an employee, through to completion. This dashboard is also useful for identifying workitems that have not been segmented and have been matched through the default path. | ||
| + | |media1=ManagerSummaryPath.png | ||
| + | }} | ||
| + | |||
| + | [[Category:V:PSAAS:Public]] | ||
| + | |||
| + | [[Category:V:PSAAS:Public]] | ||
Revision as of 16:28, September 9, 2019
Contents
Monitor workitems
The Summary tab in iWD Manager gives you several options for displaying dashboards for monitoring the state of workitems controlled by iWD:
All the displays reflect the currently selected time frame, the selected Category and Query.
By volume
Displays dynamic histogram and summary totals (total, average duration, average time in queue, average time in routing) for the selected time interval and category, and distributions by state (pie chart) and priority ranges (bar chart). You can:
- Dynamically change the time interval and category for display.
- Dynamically select a predefined query for display.
- Hover over points in any graph to display a detail panel for the selected data point.
- Use your cursor to drag a box to select a range of columns and drill down to a lower level of detail.
By backlog
Displays dynamically the overall backlog, the backlog by category, and arrival and completion volumes. You can:
- Dynamically change the time interval and category for display.
- Dynamically select a predefined query for display.
- Hover over populated areas of the graph to display a detail panel for the date and time selected.
- Use your cursor to drag a box to select a range of columns and drill down to a lower level of detail.
By SLA
Displays dynamically workitem counts for selected pre-SLA intervals, and for workitems that have breached their SLA by selected intervals. You can:
- Dynamically change the time interval and category for display.
- Dynamically select a predefined query for display.
- Hover over populated areas of the graph to display a detail panel for the date and time selected.
By categories
Displays dynamically the distribution of workitems across the available categories for the date and time selected. You can select current or historical time intervals for a rapid visual comparison.
You can also dynamically select a predefined query for display.
Hover over a Category chart to display information about that Category.
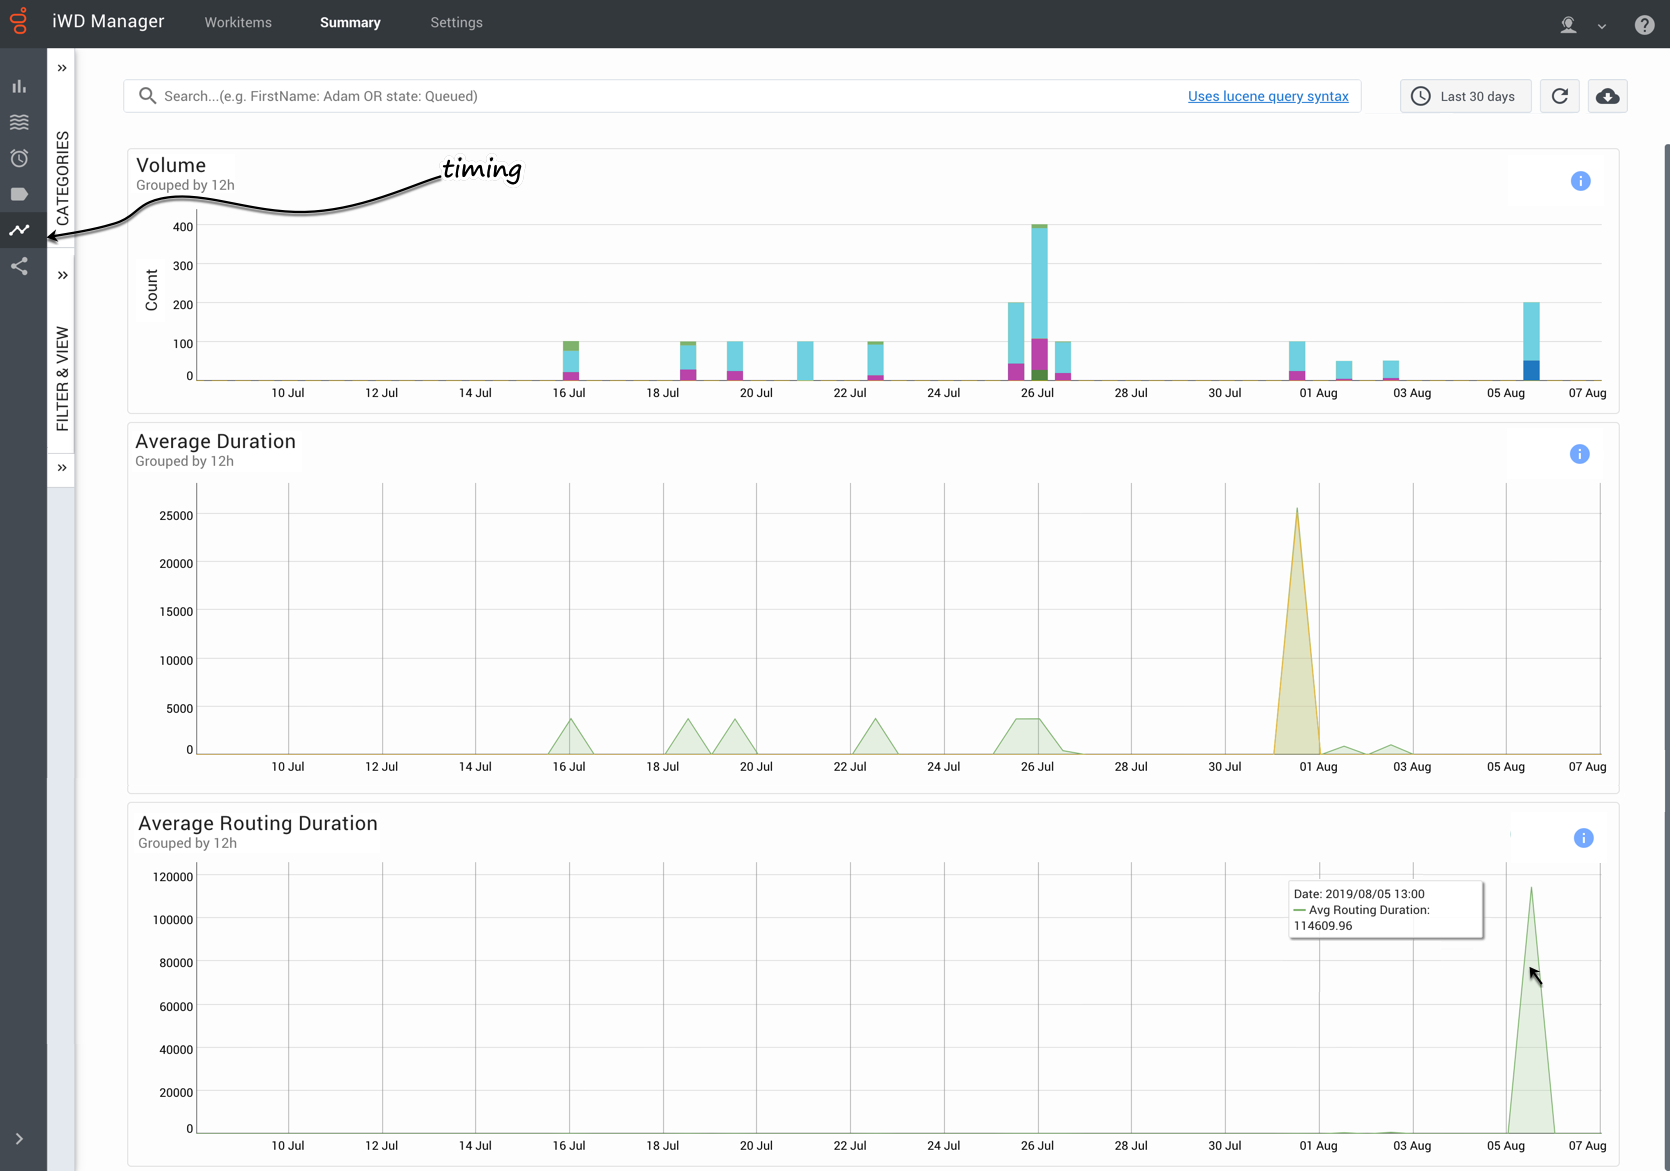
By timing
Displays dynamically the volume of transactions, plus average duration times and average routing duration times. You can:
- Dynamically change the time interval and category for display.
- Dynamically select a predefined query for display.
- Hover over populated areas of the graph to display a detail panel for the date and time selected.

