(Created target blank page For Version: PSAAS:Julie) |
(Update with the copy of version: Public) |
||
| Line 1: | Line 1: | ||
| − | <!-- | + | =Historical reporting with Genesys Interactive Insights= |
| + | |||
| + | Use historical reports to visualize the performance of your contact center over time (as contrasted against real-time reports, which show what is going on right now. Read more: [[Welcome|a discussion of the difference]].). | ||
| + | |||
| + | This page lists and describes the available Genesys Interactive Insights ready-to-use historical reports, and explains how to: | ||
| + | *Access historical reports. | ||
| + | *Run reports. | ||
| + | *Read the reports. | ||
| + | *Access the [[IncludedReports|complete list of available reports]]. | ||
| + | {{AnchorDiv|ReadyToUseReportsVideo}} | ||
| + | |||
| + | ==Video: How do I generate Historical Reports in Genesys PureEngage Cloud?== | ||
| + | |||
| + | {{CloudStep_Stack | ||
| + | <!--This video is applicable to Genesys Interactive Insights 8.1.1 releases, beginning with 8.1.105.--> | ||
| + | |title= | ||
| + | |text=This page describes how to generate your first '''Historical Report''' for your contact center. | ||
| + | <toggledisplay showtext="[+] Tip: What is a Historical Report?" hidetext="[-] Hide Tip"> | ||
| + | {{ToggleTextWrapper}} | ||
| + | '''Historical Reports''' are reports that track contact center and agent performance over a period of time. How far back in time you can look varies depending on the size and complexity of your contact center. By contrast, '''Real-time Reporting''' provides information about interactions that are taking place ''right now'' in the contact center. If you are looking for real-time reporting, or want to learn more about what the difference is, see [[Reporting|What Kind of Reports Are Available in Genesys PureEngage Cloud?]] | ||
| + | </toggledisplay> | ||
| + | |||
| + | You can generate historical reports using Genesys Interactive Insights, a component of Genesys PureEngage Cloud. | ||
| + | |video=130235719 | ||
| + | }} | ||
| + | |||
| + | {{CloudStep_Stack | ||
| + | |title=How do I access PureEngage out-of-box Historical Reports? | ||
| + | |text=#On the Genesys Portal, click the '''Reporting''' button. (It' a big green button on the '''All Apps''' or '''User''' tab.) | ||
| + | #If prompted, enter your user name and password. | ||
| + | #The Genesys Interactive Insights page appears. Expand the '''Document List''', choose '''Public Folders''', and then '''Business Edition'''. | ||
| + | #From the listed reports, double-click a report (or right-click, and choose '''View'''). | ||
| + | When you first open historical reports, they contain either no data, or data from the last time the report was run. For most reports, you can select what information to include when you generate a report. | ||
| + | |||
| + | <toggledisplay showtext="[+] Tip: What browsers are supported?" hidetext="[-] Hide Tip"> | ||
| + | {{ToggleTextWrapper}} | ||
| + | The software used to display historical reports is designed to work with Microsoft Internet Explorer or Mozilla Firefox. If you are using another browser and encounter any issues, try using Internet Explorer or Firefox. | ||
| + | </toggledisplay> | ||
| + | |media1=ReportList_Cloud.png | ||
| + | }} | ||
| + | |||
| + | {{CloudStep_Stack | ||
| + | |title=How do I navigate in Genesys Interactive Insights? | ||
| + | |text=Understanding the following terms and concepts will help you navigate the Genesys Interactive Insights GUI: | ||
| + | Within Genesys Interactive Insights, Reports are considered to be a type of 'Document': so when, for example, you see '''Document List''' in the GUI, think '''Report List'''. | ||
| + | |||
| + | When you first open Genesys Interactive Insights, the '''Home''' tab appears; return to this tab at any time by clicking '''Home''' in the main menu. | ||
| + | |||
| + | Click '''Document List''' to browse the Interactive Insights folders (where reports are stored). In most cases, what you are looking for will be found in the '''Public Folders'''. Within the Document List: | ||
| + | *'''Public Folders'''—Reports stored in the '''Public Folders''' are available to all users (security options permitting). | ||
| + | *'''My Favorites'''—Reports stored in private folders, such as '''My Favorites''', are visible only to you. | ||
| + | |||
| + | If you're not sure what folder to look in, or the name of the report to look for, you can use the search feature to easily find all relevant reports: | ||
| + | *If you are browsing in a folder, you can enter a search term in the '''Search Title''' field. | ||
| + | *For more powerful search options, click the down-arrow next to '''Search Title''', and choose '''Advanced Search'''. In the Advanced Search view, choose the search method, or combination of methods, and click '''Search'''; for example, enter <tt>Interaction Handling</tt> in the '''Search by Title''' field to list all the reports with that phrase in their names. | ||
| + | |||
| + | |media1=GI2_AdvSearch.png | ||
| + | }} | ||
| + | |||
| + | {{CloudStep_Stack | ||
| + | |title=How do I generate a report with data in it? | ||
| + | |text= | ||
| + | <ol> | ||
| + | <li>On any report, click '''Refresh All''' to load new data into the report. | ||
| + | <p> | ||
| + | The '''Prompts''' dialog box appears, where you can customize the results of the report. Note that the options available on the dialog box are unique for each report—the example shown here pertains to the Agent State Details report. | ||
| + | </p> | ||
| + | The top half of the '''Prompts''' dialog box displays a list of the various dimensions that make up the report. For each one, you can select (in the bottom part of the dialog box) what value or values to apply. In many cases, the default values are appropriate, and if this is your first time running the report, you may wish to leave them at default values until you have tried generating the report. | ||
| + | </li> | ||
| + | <li>Optionally, modify the values that are used to generate the report, before clicking '''Run Query''' to generate the report. | ||
| + | </li> | ||
| + | </ol> | ||
| + | |textwide= | ||
| + | Each report has a unique set of prompts (sometimes called ''dimensions'' or ''attributes'') from which you can select values. For the Agents / Agent Conduct Report, you can make the following selections:<br/> | ||
| + | <toggledisplay linkstyle font-size:larger showtext="[+] Show: Selecting prompts" hidetext="[-] Hide: Selecting prompts"> | ||
| + | {| | ||
| + | ! '''Prompt''' | ||
| + | ! '''Values''' | ||
| + | |- | ||
| + | | Report Date | ||
| + | | Select the day for which to generate a report. | ||
| + | |- | ||
| + | | Agent Group | ||
| + | | Optionally, restrict the report to show information about specific groups. | ||
| + | |- | ||
| + | | Agent | ||
| + | | Optionally, restrict the report to show information about specific agents. | ||
| + | |- | ||
| + | | MediaType | ||
| + | | Optionally, restrict the report to show information about media types (for example, select '''voice''' to show only voice-related data). | ||
| + | |- | ||
| + | | Interaction Type | ||
| + | | Optionally, restrict the report to show information about Interaction types (for example, select '''Outbound''' to show only data related to outbound calling). | ||
| + | |- | ||
| + | | Tenant | ||
| + | | If your environment is configured for more than one tenant, select the tenant on which to report. If you are not sure, contact you next level of support. | ||
| + | |} | ||
| + | </toggledisplay> | ||
| + | |media1=RefreshAll_Cloud.png | ||
| + | }} | ||
| + | |||
| + | {{CloudStep_Stack | ||
| + | |title=How do I read the report? | ||
| + | |text= For detailed information about how to understand reports, see [[ReadAReport|How do Reports Explain What is Happening in my Contact Center?]] | ||
| + | |||
| + | The short version is this: pretty much every report includes at least the following two tabs: | ||
| + | |||
| + | *The '''Main Tab''' provides a detailed view of the report data—for most reports, in a table. | ||
| + | *The '''Description Tab''' provides detailed information about each '''measure''' that makes up the report. Read these descriptions to understand what the Main tab (and any other tabs) are showing you. | ||
| + | |||
| + | <toggledisplay showtext="[+] Tip: What is a Measure?" hidetext="[-] Hide Tip"> | ||
| + | {{ToggleTextWrapper}} | ||
| + | In data warehousing terminology, a '''measure''' is an estimation of the magnitude of an object. For example, a measure might represent the duration of a call, or the number of agents logged in at a given moment. | ||
| + | </toggledisplay> | ||
| + | |||
| + | In addition to the '''Main''' and '''Description''' tabs, some reports include the following tabs: | ||
| + | *The '''Summary''' tab, found in many reports, provides a visual summary of the most interesting results from the report: sort of a high-level report-at-a glance. | ||
| + | *The '''Data''' tab, found in reports in the '''Business Edition''' folder, presents information in a format more suitable for printing or generating a PDF. | ||
| + | *A few reports have additional tabs, specific to the data they present. | ||
| + | |media1=RprtSmpl multiple.png | ||
| + | }} | ||
| + | |||
| + | <b>Related Topics</b>: | ||
| + | *See the [[IncludedReports|complete list of available reports]]. | ||
| + | *Learn how to [[HistoricalReporting|create or customize reports]]. | ||
| + | *Learn how to [[ReadAReport|read and understand reports]]. | ||
| + | |||
| + | [[Category:V:PSAAS:Julie]] | ||
Revision as of 17:59, June 10, 2019
Historical reporting with Genesys Interactive Insights
Use historical reports to visualize the performance of your contact center over time (as contrasted against real-time reports, which show what is going on right now. Read more: a discussion of the difference.).
This page lists and describes the available Genesys Interactive Insights ready-to-use historical reports, and explains how to:
- Access historical reports.
- Run reports.
- Read the reports.
- Access the complete list of available reports.
Video: How do I generate Historical Reports in Genesys PureEngage Cloud?
This page describes how to generate your first Historical Report for your contact center.
[+] Tip: What is a Historical Report?How do I access PureEngage out-of-box Historical Reports?
- On the Genesys Portal, click the Reporting button. (It' a big green button on the All Apps or User tab.)
- If prompted, enter your user name and password.
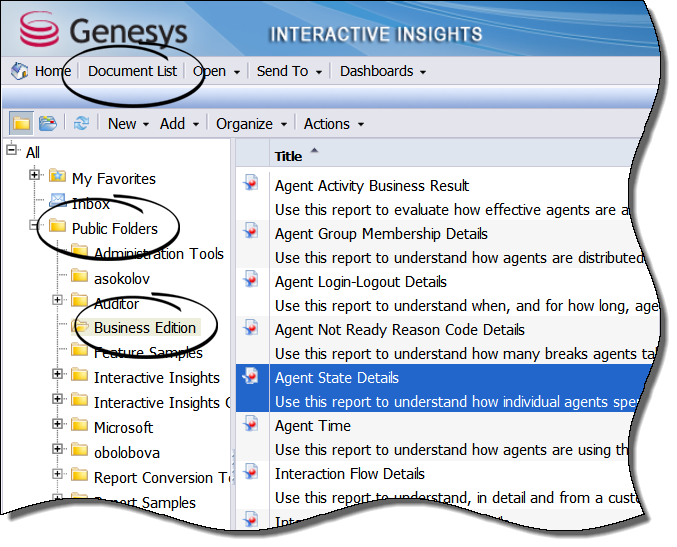
- The Genesys Interactive Insights page appears. Expand the Document List, choose Public Folders, and then Business Edition.
- From the listed reports, double-click a report (or right-click, and choose View).
When you first open historical reports, they contain either no data, or data from the last time the report was run. For most reports, you can select what information to include when you generate a report.
[+] Tip: What browsers are supported?Understanding the following terms and concepts will help you navigate the Genesys Interactive Insights GUI: Within Genesys Interactive Insights, Reports are considered to be a type of 'Document': so when, for example, you see Document List in the GUI, think Report List.
When you first open Genesys Interactive Insights, the Home tab appears; return to this tab at any time by clicking Home in the main menu.
Click Document List to browse the Interactive Insights folders (where reports are stored). In most cases, what you are looking for will be found in the Public Folders. Within the Document List:
- Public Folders—Reports stored in the Public Folders are available to all users (security options permitting).
- My Favorites—Reports stored in private folders, such as My Favorites, are visible only to you.
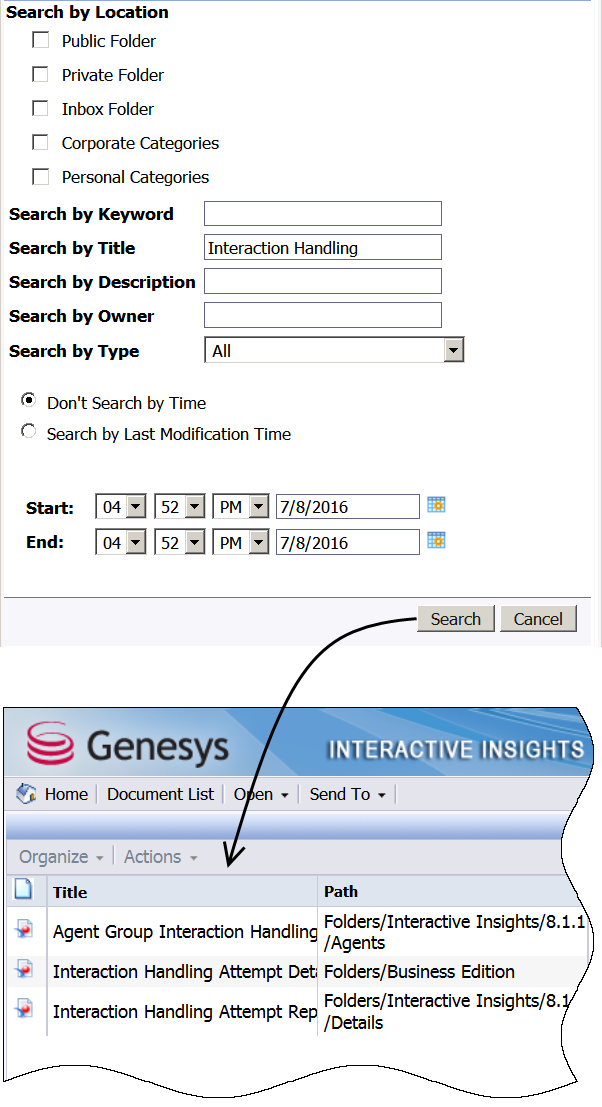
If you're not sure what folder to look in, or the name of the report to look for, you can use the search feature to easily find all relevant reports:
- If you are browsing in a folder, you can enter a search term in the Search Title field.
- For more powerful search options, click the down-arrow next to Search Title, and choose Advanced Search. In the Advanced Search view, choose the search method, or combination of methods, and click Search; for example, enter Interaction Handling in the Search by Title field to list all the reports with that phrase in their names.
How do I generate a report with data in it?
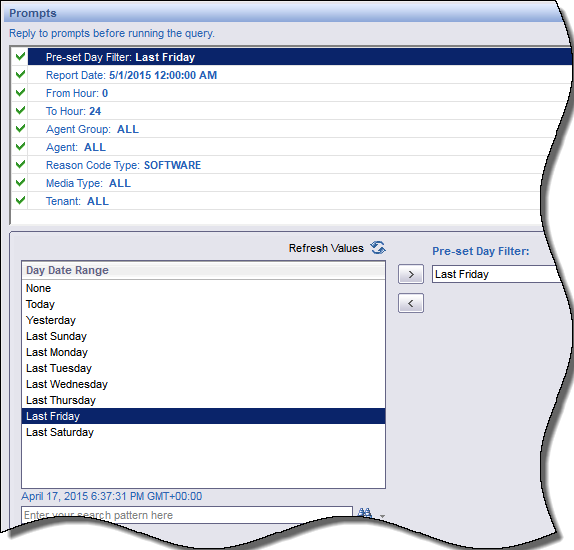
- On any report, click Refresh All to load new data into the report.
The Prompts dialog box appears, where you can customize the results of the report. Note that the options available on the dialog box are unique for each report—the example shown here pertains to the Agent State Details report.
The top half of the Prompts dialog box displays a list of the various dimensions that make up the report. For each one, you can select (in the bottom part of the dialog box) what value or values to apply. In many cases, the default values are appropriate, and if this is your first time running the report, you may wish to leave them at default values until you have tried generating the report.
- Optionally, modify the values that are used to generate the report, before clicking Run Query to generate the report.
[+] Show: Selecting prompts
How do I read the report?
For detailed information about how to understand reports, see How do Reports Explain What is Happening in my Contact Center?
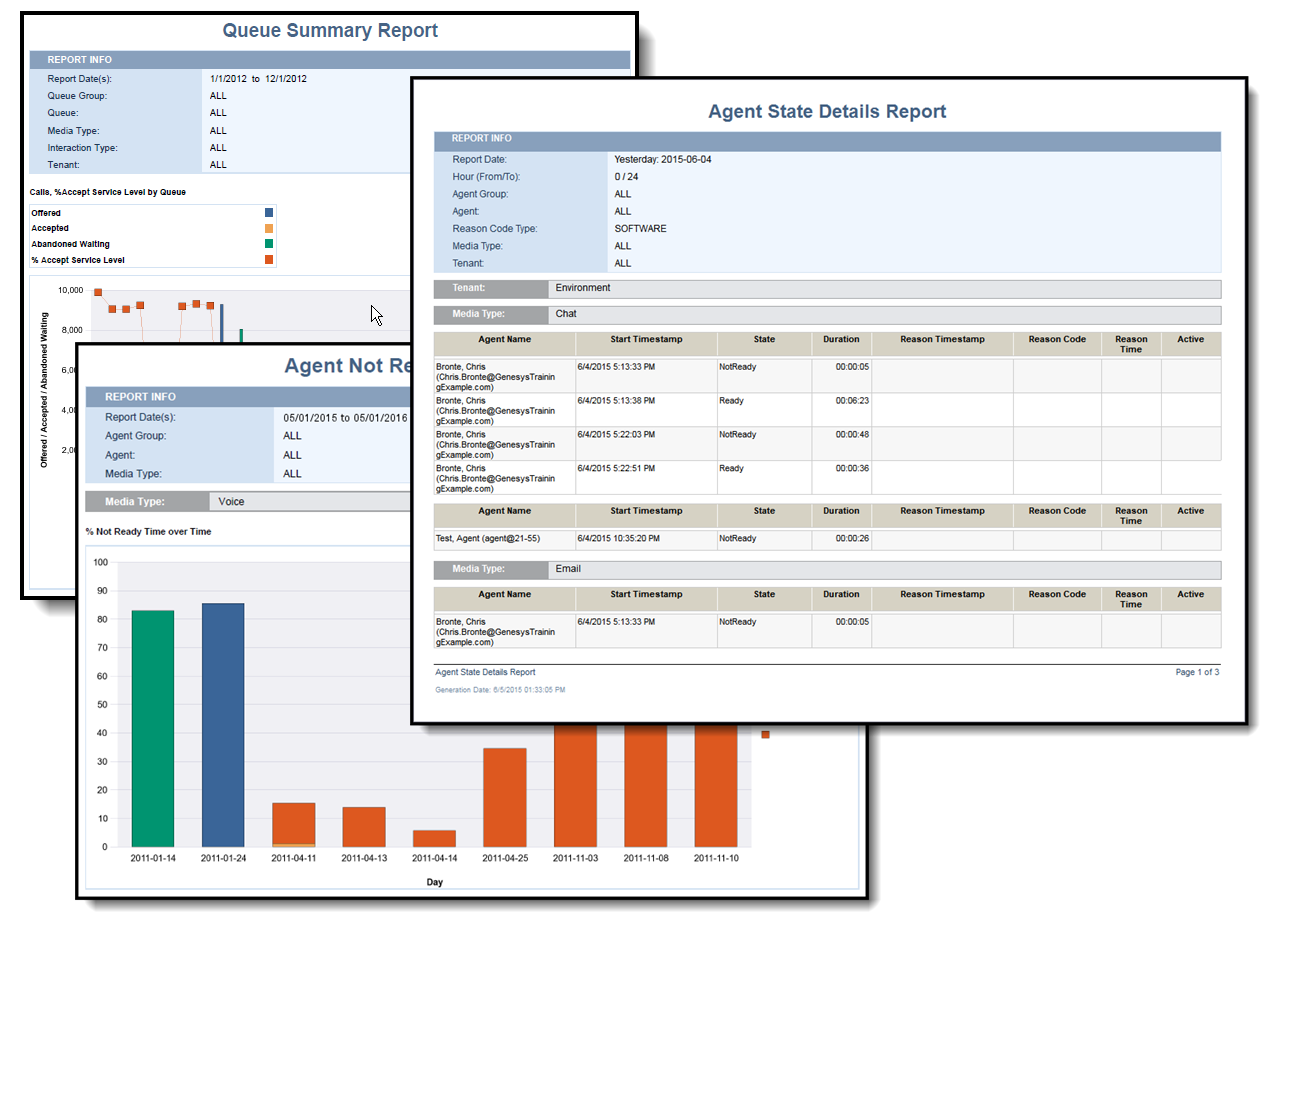
The short version is this: pretty much every report includes at least the following two tabs:
- The Main Tab provides a detailed view of the report data—for most reports, in a table.
- The Description Tab provides detailed information about each measure that makes up the report. Read these descriptions to understand what the Main tab (and any other tabs) are showing you.
Related Topics:
- See the complete list of available reports.
- Learn how to create or customize reports.
- Learn how to read and understand reports.


