(Update with the copy of version: 8.5.0) |
(Update with the copy of version: draft) |
||
| Line 1: | Line 1: | ||
| − | =Real-time Reporting with Pulse= | + | =Real-time Reporting with Genesys Pulse 8.5= |
<onlyinclude> | <onlyinclude> | ||
{{BEC_Head | {{BEC_Head | ||
Revision as of 02:37, March 6, 2020
Real-time Reporting with Genesys Pulse 8.5
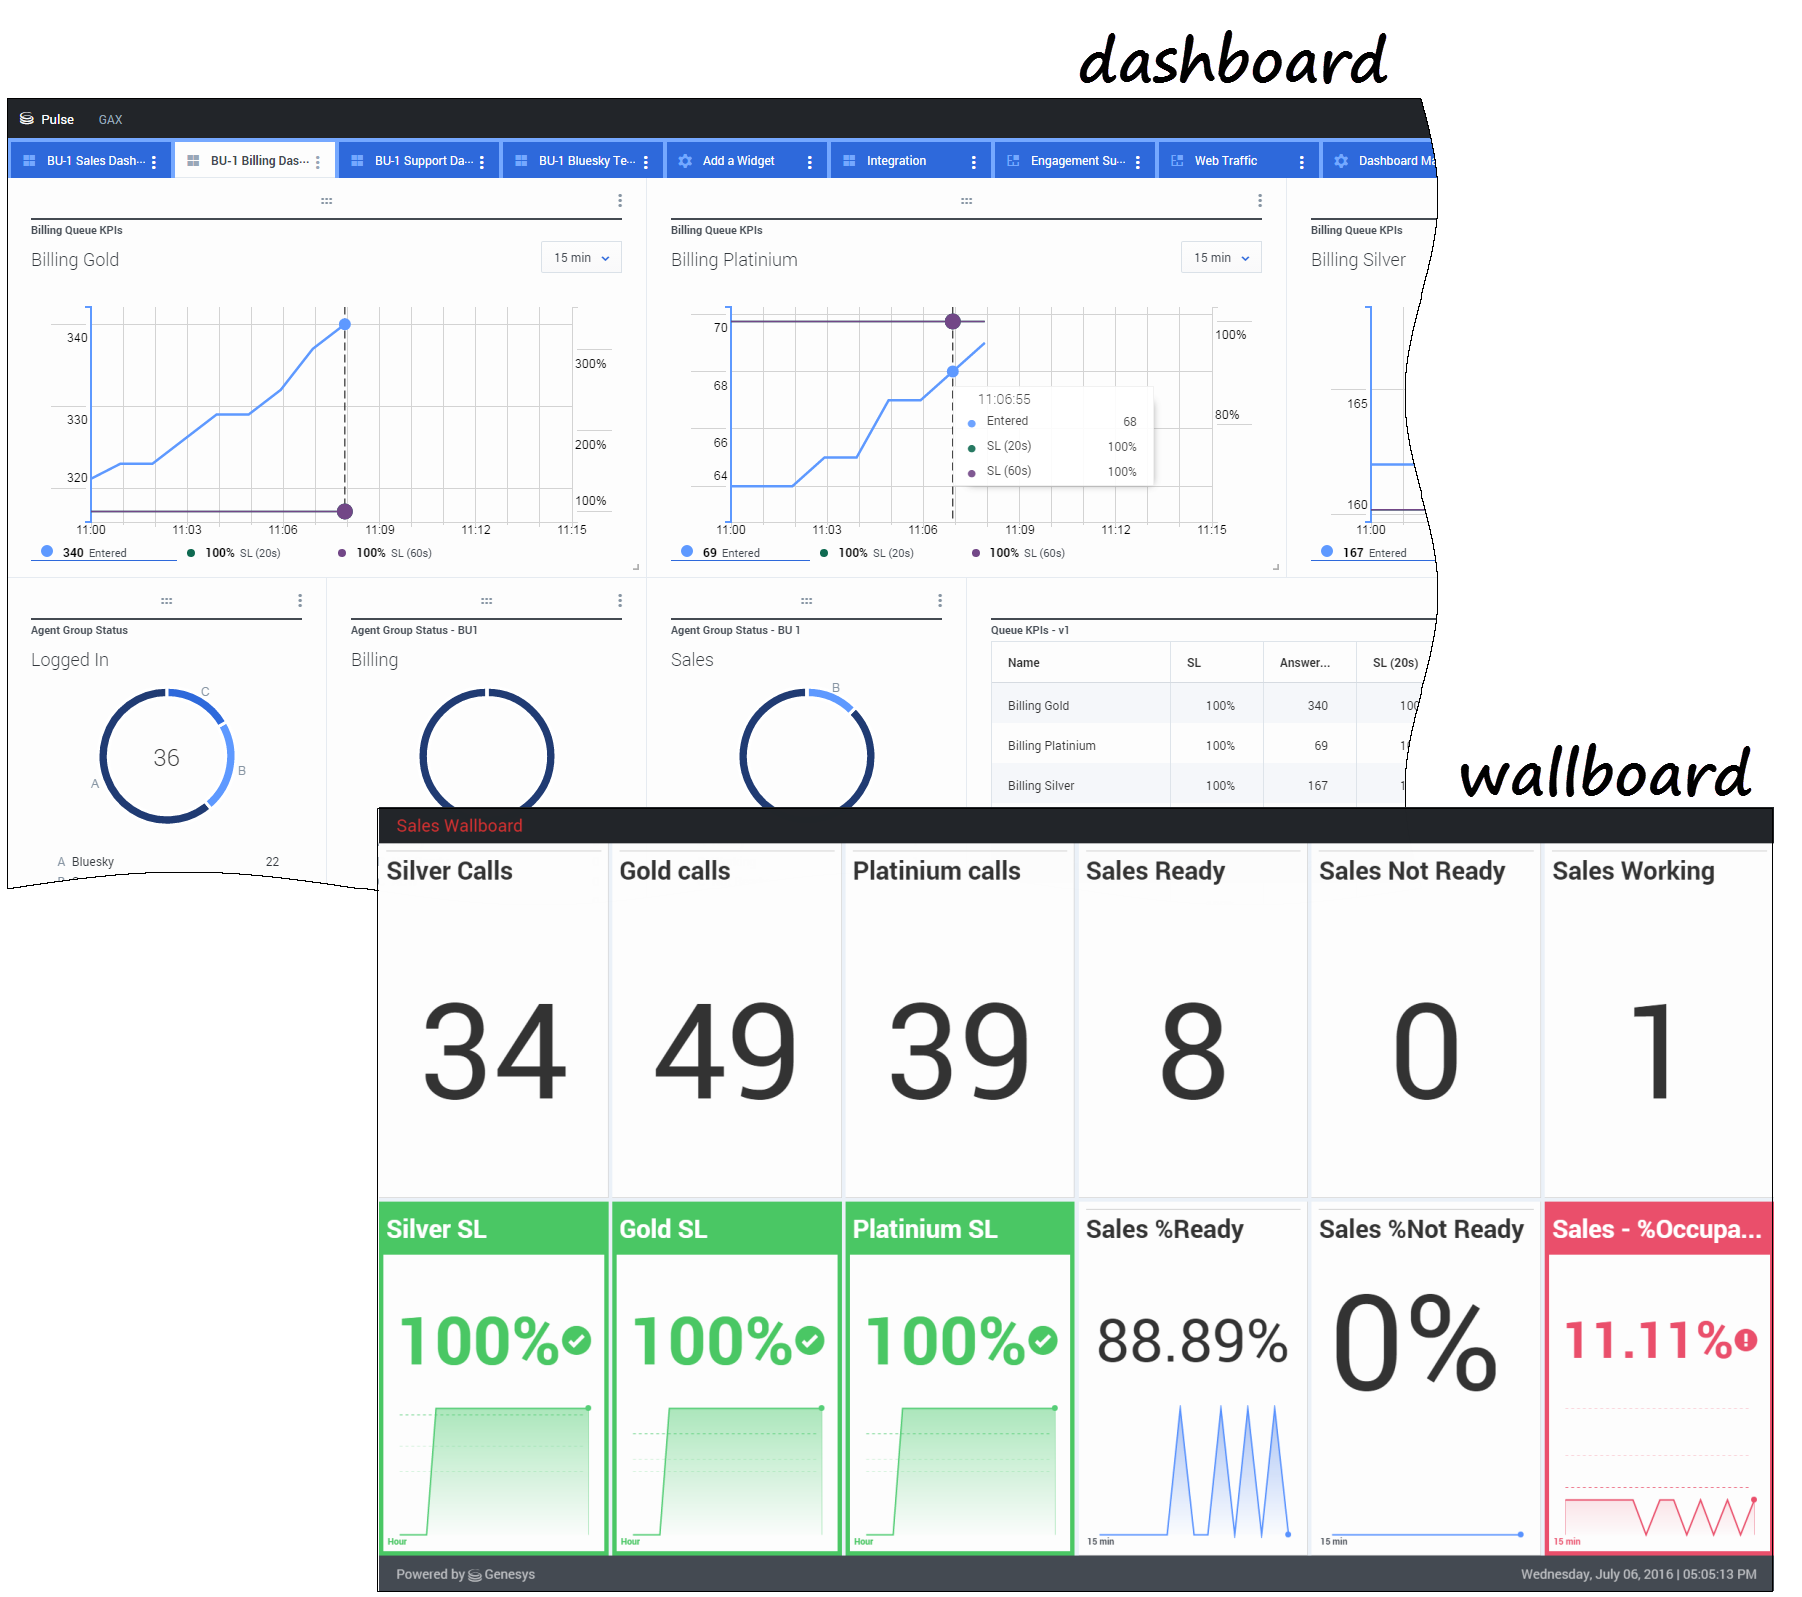
Genesys Pulse provides at-a-glance views of real-time contact center statistics on dashboards within the user interface.
Important
You require the appropriate user privileges to perform actions.
You can
- view reports in widgets on either your Genesys Pulse dashboard or wallboard.
- customize widgets to display user-defined Donut, Grid, Key Performance Indicator (KPI), or List charts.
- use custom templates to quickly create report widgets for your dashboard.
Ready? Get started.
Looking for answers to specific questions? Try these topics:
New to Pulse
Your version of Pulse might not include all the new functionality covered in this guide:
- Wallboards are now available.
Comments or questions about this documentation? Contact us for support!

