Contents
Enabling Agents to View KPIs and Contact Center Statistics
The Workspace agent desktop includes two optional tabs that you can configure to display real-time agent Key Performance Indicators (KPIs) (My Statistics) and contact center statistics (Contact Center Statistics). KPIs enable agents to focus on their efficiency and to compare their performance against that of their colleagues. Contact center statistics enable agents to focus on their efficiency and to compare their performance against that of their colleagues.
To enable KPIs and statistics, you must first set up the statistic.yaml, which contains a list of statistics that can be requested from Stat Server. You then create sections in the Workspace Application object that correspond to the statistic names in the statistic.yaml file that you want to use. Finally, you configure the KPI and Contact Center Statistics options to display the statistics to your agents.
statistics.yaml Setup
Workspace reports statistics based on the statistic names in the statistics.yaml file which is included with Web Applications and Services. The file contains all of the statistics that Workspace needs internally as well as those that are required by the agent and supervisor applications.
The statistics.yaml file is located in the main Web Services config folder (this is defined by the config.path variable, which is set to /opt/jetty/genconfig by default on the Ubuntu voice machine).
The following is an example entry in the statistics.yaml file. The name of the statistic is OutboundCalls. To use this statistic, create a section in the WS_Cluster application object by using Genesys Administrator (or Configuration Manager) such as KPI-OutboundCalls, then create an option in the section called statistic-name and assign OutboundCalls as the value. You can also create an option in the section called description and specify the value as Total number outbound calls.
name: OutboundCalls
notificationFrequency: 10
notificationMode: PERIODICAL
objectType: AGENT
statisticDefinitionEx:
    category: TotalNumber
    dynamicTimeProfile: "0:00"
    intervalType: GrowingWindow
    mainMask: CallOutbound
    subject: DNAction
Click the link below to see an example of a statistics.yaml file:
Web Services Node Configuration
The value of the nodeId property must be set in the server-settings.yaml file. The value of this option must be a unique identifier for each node in a Web Services cluster. All nodes that share the same Cassandra storage read the contact centers that require statistics and divide the monitoring tasks among the nodes.
Statistics Time-to-Live
You can define the time-to-live for statistic storage in server-settings.yaml file by using the statisticsTTL property. If this optional parameter is not defined, the default value of 86400 (24 hours) is used. This property defines the interval of time for which the value of the statistics are stored.
KPIs
To display statistics (KPIs) in the My Statistics tab of the Workspace interface, you must specify at least one statistic in the kpi.displayed-kpis option.
The following is an example of how to specify the InboundCalls statistic for display:
- Choose a statistic from the statistics.yaml file that you want to display, such as InboundCalls.
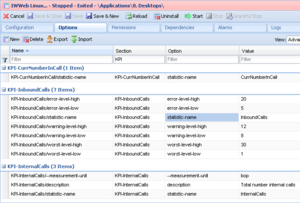
- Create a section in the WS_Cluster application object by using Genesys Administrator (or Configuration Manager) such as KPI-InboundCalls
- Create an option in the section called statistic-name.
- Assign InboundCalls as the value.
- (Optional) You can create other options in the section to specify a display name, such as description with the value as Total number inbound calls.
The attributes that you can specify include:- statistic-name(mandatory)
- target-value
- warning-level-low
- warning-level-high
- error-level-low
- error-level-high
- worst-value-low
- worst-value-high
- statistic-type — possible values are: duration, number. If statistic-type isn't specified, the default type is number excepted if the statistics name includes the duration keyword.
- measurement-unit — an optional display value.
Refer to Setting the Warning, Error, and Worst Levels for more information about how to use the target, warning, error, and worst attributes.
- Repeat steps 1 through 5 for each statistic that you want to use.
- In the interaction-workspace section in the WS_Cluster application, specify the name of the section that you created in Step 2 as one of the values of the kpi.displayed-kpis option. The value of this option is a coma-separated list of section names defined in the WS_Cluster application. Specify the statistics in the order in which you want the statistics to be displayed in the Workspace interface. For example: KPI-InternalCalls,KPI-OutboundCalls,KPI-InboundCalls,KPI-CurrentTargetState,KPI-CurrNumberInCall
Contact Center Statistics
To display contact center statistics in the Contact Center Statistics tab of the Workspace Web Edition interface, you must specify at least one statistic in the statistics.displayed-statistics option.
The following is an example of how to specify the AverageWaitingTime statistic for display:
- Choose a statistic from the statistics.yaml file that you want to display, such as InboundCalls.
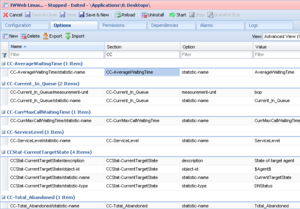
- Create a section in the WS_Cluster application object by using Genesys Administrator (or Configuration Manager) such as CC-AverageWaitingTime
- Create an option in the section called statistic-name.
- Assign AverageWaitingTime as the value.
- (Optional) You can create other options in the section to specify a display name, such as description with the value as Average Customer Wait Time.
The attributes that you can specify include:- statistic-name(mandatory)
- target-value
- warning-level-low
- warning-level-high
- error-level-low
- error-level-high
- worst-value-low
- worst-value-high
- statistic-type — possible values are: duration, number. If statistic-type isn't specified, the default type is number excepted if the statistics name includes the duration keyword.
- measurement-unit — an optional display value.
Refer to Setting the Warning, Error, and Worst Levels for more information about how to use the target, warning, error, and worst attributes.
- Repeat steps 1 through 5 for each statistic that you want to use.
- In the interaction-workspace section in the WS_Cluster application, specify the name of the section that you created in Step 2 as one of the values of the statistics.displayed-statistics option. The value of this option is a coma-separated list of section names defined in the WS_Cluster application. Specify the statistics in the order in which you want the statistics to be displayed in the Workspace interface. For example: CC-AverageWaitingTime,CC-Current_In_Queue,CC-CurrMaxCallWaitingTime,CC-ServiceLevel,CC-Total_Abandoned,CC-Total_Answered
- Specify the queue group, agent group, routing point, and/or virtual queue for which you want statistics reported by using the following options:
- Use the permissions.agent-group.exclude option to specify the list of agent groups to be excluded from Statistics.
- Specify the refresh time, in seconds, for the statistics in the Contact Center Statistics tab by using the statistics.refresh-time option.
Setting the Warning, Error, and Worst Levels
Workspace provides eight non-mandatory options that you can use to define low and/or high levels of warning and error and low and/or high levels of worst values.
Some statistics are in an error state when they are below a certain value, while others are in an error state when they are above a certain value; for some statistics both a lower error threshold and a higher error threshold are required. The following non-mandatory options enable you to set a low and high threshold for a statistic:
- error-level-low—Values below this value are in an error state for the statistic.
- error-level-high—Values above this value are in an error state for the statistic.
Some statistics are in a warning state when they are below a certain value, while others are in a warning state when they are above a certain value; for some statistics both a lower warning threshold and a higher warning threshold are required. The following non-mandatory options enable you to set a low and high threshold for a statistic:
- warning-level-low—Values below this value are in a warning state for the statistic.
- warning-level-high—Values above this value are in a warning state for the statistic.
Use the error and warning options to specify ranges that are most suitable for the statistic.
Some statistics are performance based. The agent's result is compared to a target value to determine the agent's level of performance. Some statistics require a lower worst value and some require a higher worst value. For some statistics, both a lower and a higher worst value are required.
- worst-value-low—Values below this value result in a negative evaluation for the KPI.
- worst-value-high—Values above this value result in a negative evaluation for the KPI.
- target-value—The target value to be reached by the agent.
- evaluation-display—Specifies which value is displayed to the agent, a performance indicator or the raw statistic in the format of the statistic (for example, number, date, or percentage). If the option is set to Result, the actual statistic value is displayed. If the option is set to Evaluation, the performance of the agent is calculated by using the following formulae:
If the statistic value is lower than the target value, the following evaluation is applied: Agent Performance = (Agent Result - worst-value-low) / (Target Value -worst-value-low) x 100 or: If the statistic value is higher than the target value, the following evaluation is applied: Agent Performance = (worst-value-high - Agent Result) / (worst-value-high - Target Value) x 100
Example of a Statistics Configuration file for Workspace
The following is an example of a configuration (.cfg) file that is related to a statistics configuration for the options in a WS_Cluster object that was exported from Configuration Manager:
Stat Server Configuration
Any Stat Server application in a Genesys environment to which the Web Services node/cluster will connect must include a set of statistic definitions that match those that are specified in the statistics.yaml file.
- Only Agent Statistics should be specified for KPIs.
- Only Queue Statistics should be specified for Contact Center Statistics.


