How do I access historical reports?
This page describes how you can navigate in CX Insights, how you can access and run/generate historical reports, and how you can control what data is included in reports. You can also go straight to a complete list of available reports.
[+] Tip: What browsers are supported by Genesys CX Insights?
MicroStrategy (the engine that powers Genesys CX Insights) certifies the latest versions, at the time of release, for the following web browsers:
- Apple Safari
- Google Chrome (Windows and iOS)
- Microsoft Edge
- Microsoft Internet Explorer (Versions 9 and 10 are supported, but are not certified)
- Mozilla Firefox
Video: How do I generate Historical Reports using Genesys CX Insights?
This video describes how to generate historical reports using GXCI, a component of Genesys Cloud.
[+] Tip: What is a Historical Report?
Historical Reports are reports that track contact center and agent performance over a period of time. How far back in time you can look varies depending on the size and complexity of your contact center. By contrast, Real-time Reporting provides information about interactions that are taking place right now in the contact center. If you are looking for real-time reporting, or want to learn more about what the difference is, see What Kind of Reports Are Available in Genesys PureEngage Cloud?
How do I access historical reports?
- On the Genesys Portal, click the Reporting button. (It's a big green button on the All Apps or User tab.)
- If a page appears where you can select a server, choose the server on which to view reports (you probably have only one, but if more than one appears, and you are not sure which one to select, contact your administrator).
- If prompted, enter your user name and password.
- The Genesys CX Insights page appears. Click Shared Reports > CX Insights.
- Reports are divided into subfolders based on function; select a sub-folder, for example Business Results.
- From the listed reports, either double-click a report, or right-click and choose Run. For example, Business Metrics Executive Report. The prompts for that report appear.
- Select a date or date range, and optionally make selections for other prompts.
- Click Run Report.
The report appears. Note that you can filter, drill, and otherwise interact with many report values.
Many reports offer a long list of prompts, but you don't have to make selections at all those prompts.
For most reports, you can simply select a Report Date (or Start Time/Date and End Time/Date, depending on the report), or a value from the Pre-set Day Filter list, and click Run Report to generate the report. Note that selecting a Pre-set Day Filter value overrides any Report Date or Start / End selections.
For more information about prompts, see
How do I control what data appears in a report?
How do I navigate in Genesys CX Insights?
As you browse in Genesys CX Insights, clickable breadcrumbs are displayed at the top and bottom of the page:
Shared Reports > CX Insights > Business Results
Click any word in the breadcrumb to return to that folder.
In most cases, what you are looking for will be found in the Shared Reports folder.
- Shared Reports—Reports and dashboards stored in the Shared Reports are available to other users (access privileges permitting).
- My Reports—Reports stored in your private folders, such as My Reports, are visible only to you.
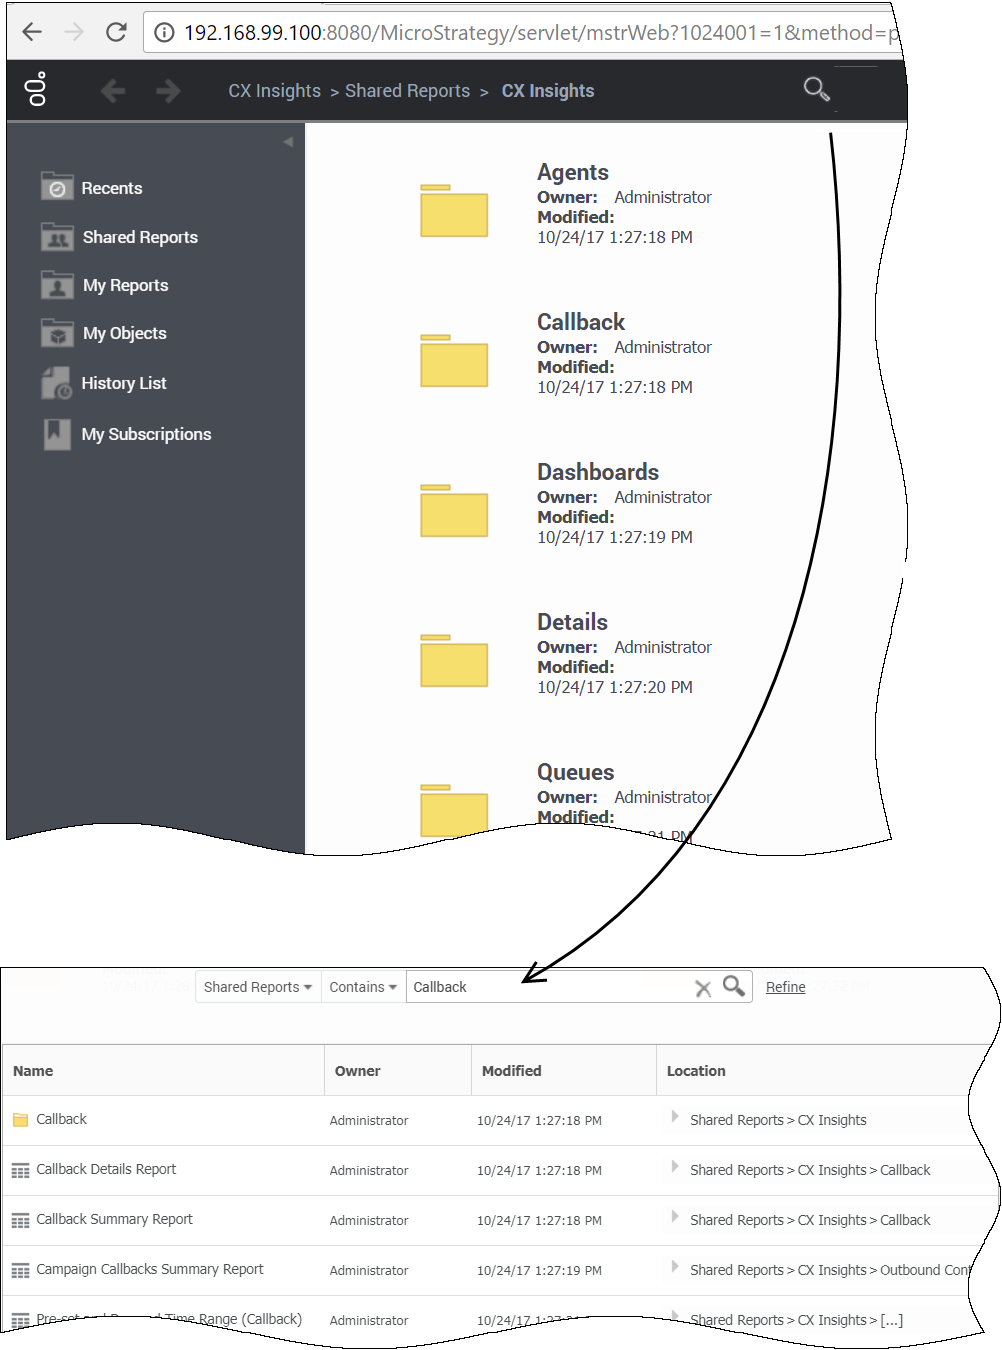
If you're not sure what folder to look in, or the name of the report to look for, you can use the search feature to easily find all relevant reports:
- At the top of the page, click the magnifying glass to open the search window.
- Select a folder (for example Shared Reports) in which to search, enter a search term (for example Callback), and press Enter (or click the magnifying glass).
- For more powerful search options, click Refine. Advanced search options appear, which you can use to refine your search based on various criteria, such as onbject type, owner, date, or description.
How do I control what data appears in a report?
In many cases, you may want to restrict what data is gathered into a report; for example:
- if your environment contains a very large amount of data, some reports can become very long.
- if you want to see a report about just one aspect of the contact center, such as single agent group.
When you open any report, the report prompts appear, where you can customize the data that is taken into the report. The prompts available are specific to each report—the example shown here pertains to the Agent Conduct Report:
- For each prompt, enter or select appropriate values. Each prompt provides either a drop-down list or a search field and accompanying button.
- Use the Index, to the left of the prompts input area, to quickly jump to any section of the prompts.
In many cases, the default values are appropriate; if in doubt about a given prompt's effect, see the descriptions given below, or try running the report with default values to get a better idea of the result.
For the Agents / Agent Conduct Report, you can make the following selections:
[+] Show: Prompts in the Agent Conduct Report
| Prompt
|
Description
|
| Report Date
|
Select the day for which to generate a report. (This report describes activity for a single day).
|
| Agent Group
|
Optionally, restrict the report to show information about specific groups.
|
| Agent Name
|
Optionally, restrict the report to show information about specific agents.
|
| Media Type
|
Optionally, restrict the report to show information only for specific Media Types.
|
| Interaction Type
|
Optionally, restrict the report to show information only for specific Interaction Types.
|
| Tenant Name
|
In multi-tenant environments, you can optionally restrict the report to show information only for the selected tenant.
|
Each report has a unique set of prompts from which you can select values for the attributes used in the report.
Related Topics:


