
How do reports explain what is happening in my contact center?
Contents
- 1 How do reports explain what is happening in my contact center?
- 1.1 Video: How do I drill or filter historical reports in Genesys PureEngage Cloud?
- 1.2 How do I see what's happening, at a glance? (Summary tab)
- 1.3 What do these values mean? (Description tab)
- 1.4 Is there more detailed information? (Main & Data tabs) — How do I filter the data?
- 1.5 How do I drill in a report?
- 1.6 There's a lot of information here — Can I print/export a report?
- 1.7 Where can I learn more about Genesys Interactive Insights?
When you need to know exactly what's happening in your contact center, it helps to understand how to read and control reports: What do the symbols, graphics, and measures mean? How can I control the reports to show me just what I need to see? How do I share the results of a report with others?
This page describes how to read and understand a report, how to filter the results, and how to share or save a report.
Video: How do I drill or filter historical reports in Genesys PureEngage Cloud?
This video describes how to read, drill, and filter historical reports in Genesys Interactive Insights.
How do I see what's happening, at a glance? (Summary tab)

Reports with a Summary tab, such as the Queue Summary Business Results report, provide a visual summary of the report results in a chart or graph format.
For most reports, the Summary tab shows only the values associated with key measures—not all of the measures that are part of the report.
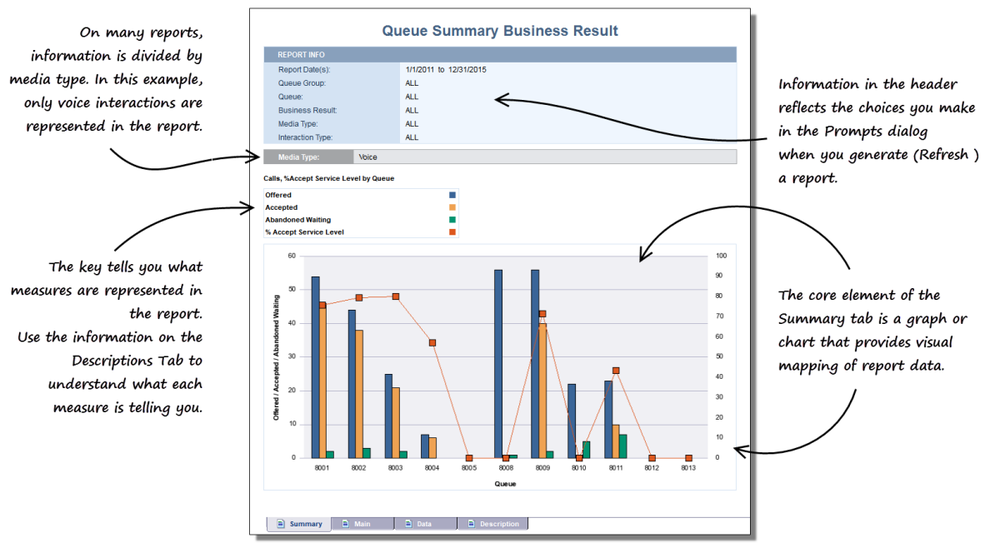
In this example, the values across the bottom (8001, 8002, 8003) represent queues, while the blue, yellow, and green bars represent the number of interactions with a disposition of Offered, Accepted, and Abandoned Waiting, respectively. More information about these measures is provided on the Descriptions tab.
What do these values mean? (Description tab)

To learn anything from a report, you have to understand the measures that are used in the report. Measures are simply representations of the size or amount of something in the contact center.
For example, a measure might represent the duration of a call, the time an interaction started or ended, or may be some other count, such as Abandoned Waiting, which shows the number of customer interactions that were abandoned by the customer (in other words: how many times did a caller get tired of waiting, and just hang up?).
Still other measures are values that result from a calculation, such as % Abandoned Waiting which is the percentage of interactions that were Abandoned Waiting.
Is there more detailed information? (Main & Data tabs) — How do I filter the data?

The Main and Data tabs provide two different views of the report data. Both tabs show the full results of the report, in the form of a table:
- The Main tab shows the report data in an easy-to-read format. This is best for reading the data onscreen, or for printing to a PDF.
- The Data Tab shows the report data in a format more suitable for export to CSV.
The Main & Data tabs may seem to present an overwhelming amount of information, particularly if your contact center database provides a very large number of records. Fortunately, there are a number of ways in which you can filter reports, even after you generate them.
On the Report Filter toolbar, you can add one or more filters, and thereby view only the data that interests you:
- Click Show/Hide the Report Filter Toolbar.
- On the Report Filter toolbar, click to add one or more filters.
- For each filter, select the value on which to filter. .
The Filter options provide a more versatile set of choices than those you can make in the Prompts dialog when you Refresh a report, so it is both a quick and powerful way to narrow the report results.
How do I drill in a report?

You can Drill on report data to see more detailed information; beyond the summary you see in the report.
Tip: Before using Drill, it's a good idea to configure the relevant options. Click Preferences > Web Intelligence Preferences, and make choices in the Drill options and Start drill session sections. You might want to enable "On duplicate report" so that the results of your original report are preserved for comparison purposes.
- To drill on a report, first open and refresh the report.
- Click Start drill mode.
- Right click where data appears in the report, and select one of the drill actions that appear. The choices available vary depending on the type of data on which you click ('Drill down to Agent Name', 'Drill up to Month', 'Drill down to Interaction subtype', and so on). Not all data can be drilled.
- A drill filter drop-down list appears at the top of the report; from the list, choose the value on which to filter.
Note that you can apply more than one Drill filter to a report.
There's a lot of information here — Can I print/export a report?

In fact, you can easily export your reports to a variety of formats, including PDF (ideal for printing) or Excel/CSV (ideal if you want to take the data into other applications, manually edit the output, or what have you).
- To save the entire report (all tabs) choose Document > Save to my computer as > , and then select the format to which you wish to save the report.
- To save only the current tab, choose Document > Save report to my computer as > , and then select the format to which you wish to save the tab.
Some users find it very useful to export data to a spreadsheet format. For example, if you export the Main tab to Excel or CSV, you can more easily sort and view the data, particularly if there is a lot of data in your report, due to the larger screen area available in a spreadsheet application, such as Microsoft Excel.
The Data tab presents the same information, but is formatted to be more useful when exported to CSV; so you may wish to experiment with exporting both tabs, depending on your needs.
Where can I learn more about Genesys Interactive Insights?

Click Help to access the latest online help for BO Web Intelligence, which is the engine that drives Genesys Interactive Insights. In addition to the online Help included with Genesys Interactive Insights, see Historical Reporting and other pages in this series.
Related Topics:
- See a complete list of available reports.
- Learn how to create or customize reports.
- Learn how to generate historical reports.