Contents
Session Detail Records
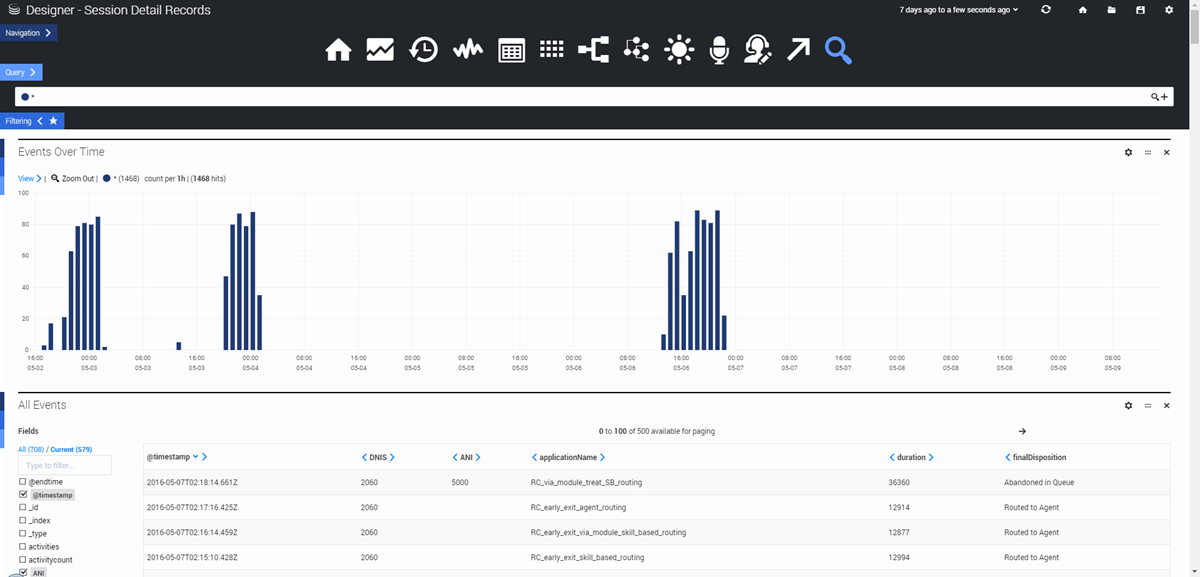
The Session Detail Records dashboard lets you view (and query) some of the raw data contained in the Session Detail Records (SDRs).
Reports on this dashboard
Events Over Time
Similar to Count Over Time, this report shows the number of events that were logged during the given time period.
All Events
Basically, this is a table showing raw data information for all application sessions that were active during the given time period. You can use the Fields check boxes to select which columns to display. You can then search the results for the selected columns by toggling the Query option and entering your own query.
Searching the Session Detail Records
You can use the Query tab to enter a custom search query. For example:
applicationName:Joules\ Coulomb\ Direct\ Sales AND finalDisposition:Abandoned\ in \Self\ Service AND ANI:7031231234This query would search the Joules Coulomb Direct Sales application for sessions where the final disposition was Abandoned in Self Service and the ANI was 7031231234. Note that operators (such as AND or OR) are in caps and that a backward slash (\) is needed when using terms that include spaces.
You can also use operators to search for fields that do (or do not) have values. For example, to include all SDRs where the DNIS field contains a value, you could use the following expression in your query:
DNIS:*
In this expression, the asterisk (*) acts as a wildcard to represent any value.
Or, if you wanted to include SDRs where the DNIS field does not contain a value (is blank):
-(DNIS:*)
In this expression, the minus sign (-) acts as a negative operator. The asterisk (*) again acts as a wildcard to represent any value, even one that is empty.
After the results are generated, click an event to expand it. You can then view its details in Table, JSON, or Raw format. When an event is expanded, you can also use the Action menu to add/remove the item from the filter, or to add/remove that column from the table.

